

As previewed, domestic attendance to Disneyland and Disney World strengthened* QoQ around +300bps to +2% YoY growth, benefiting from its compelling storytelling and attractions, leverage to more affluent households, and lapping disruptive Hurricane Milton in the base period. (Disney reported +1% increase in attendance, a figure that was held back due to lower international visits to Disneyland / Disney World, a population that our data does not observe. Adjusting for the international headwind implies the +2% figure.) The increase came alongside Universal also reporting strong attendance, and both operators reported strong per-cap metrics and not promotional discounts to “borrow market share.” Disney reported a +4% increase in average per-capita ticket revenue. The attendance / affluence dynamic also drove a +4% increase in in-park per-cap spending and a +200bps increase in hotel occupancy (when excluding international visitation, both figures will have been higher.)
The Domestic Parks’ strong top-line (+7%) was matched by a strong bottom-line (+8%); however, the slight earnings leverage to pricing was perhaps less than some expected. More guest service hours and the cost of new attractions, while fueling the attendance gains, limited the earnings flow-through. (It’s possible that part of the increase in Advan’s observed visits was due to the more service hours.) Nevertheless, the high guest satisfaction and favorable brand appeal are evident in the Park forward bookings at +5% from the remainder of the fiscal year (leverage to more affluent households also helps, a decline in international bookings hurts).
See our last write-up on industry trends here and here.
‘*FQ4’s attendance to the domestic figure was not explicitly reported, Morgan Stanley has it as -2%. Relatedly, for FQ4’25, management did not explicitly call out international as a headwind, whereas for FQ1 they did. We take this to be a -100bps QoQ. And so, FQ4 was “reported” at -2%, for FQ1 it’s +1% including the -100bps from international, or +2% underlying, which totals a +400bps QoQ swing for domestic visitors to the domestic parks.
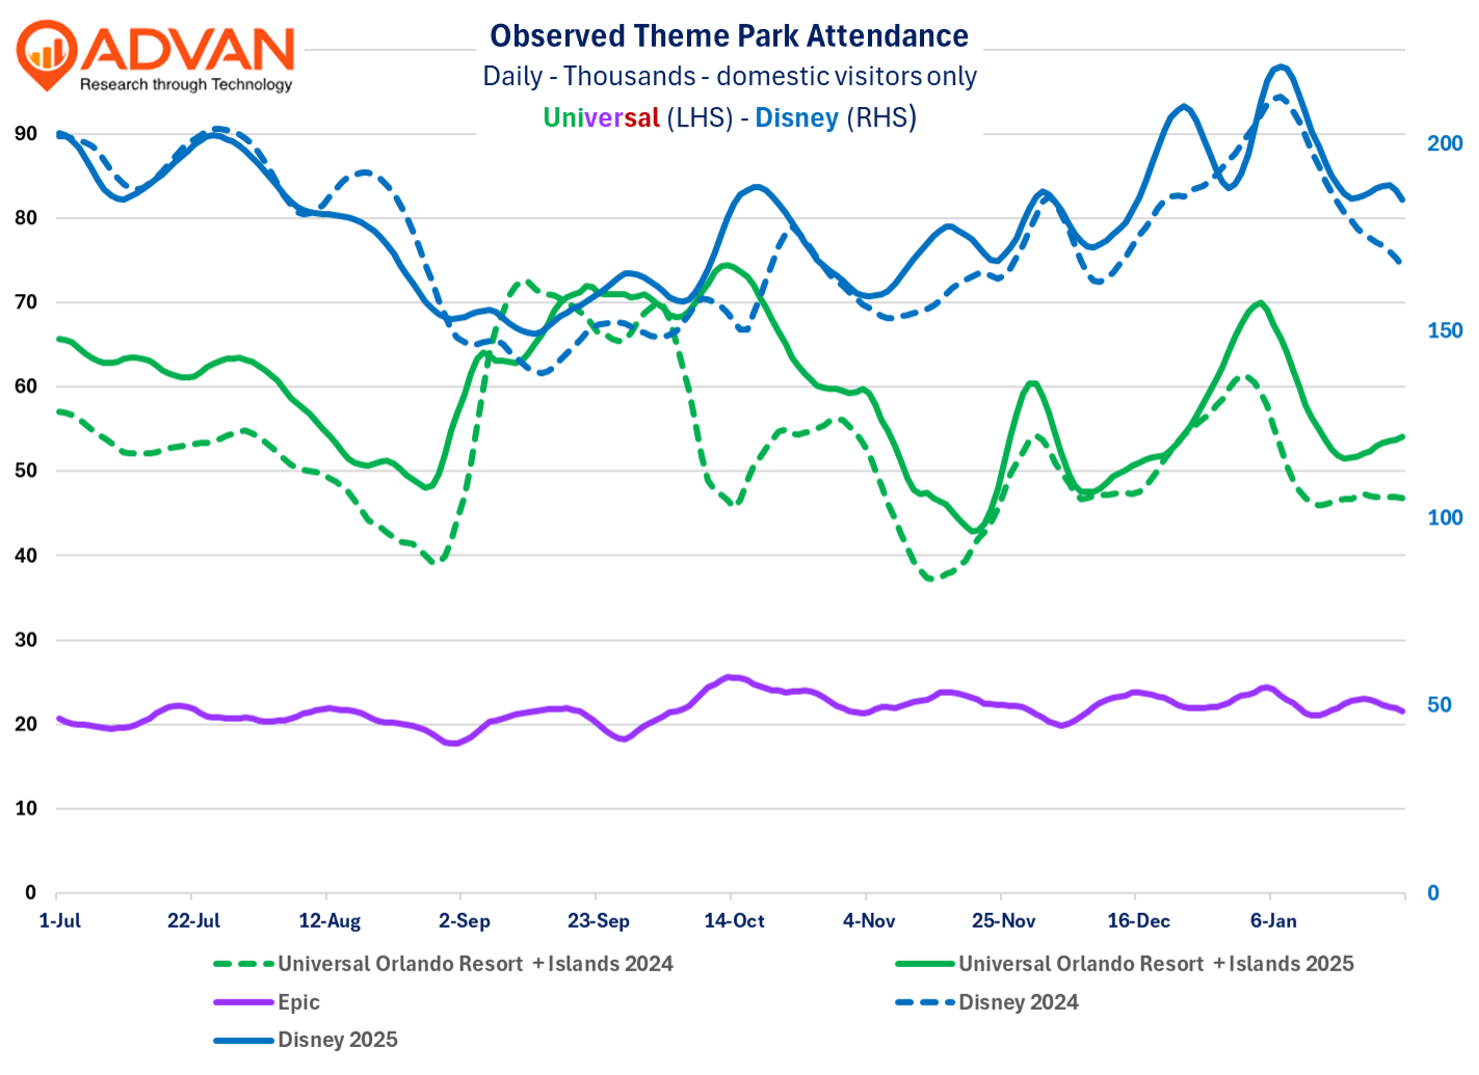
Advan’s normalized observed visits were +3.6% for the December quarter, +520bps QoQ. The amplification of our data (vs. the reported-implied +400bps) likely stems from data noise caused by Hurricane Milton, something that we have witnessed across industries (and perhaps a little from the increased staffing). More specifically, observed visits to Disneyland were flat for the December quarter, whereas Disney World observed visits increased +7%, which is unrealistically high and inclusive of “noise.” The chart shows that Milton had a larger impact on Universal than Disney.