

Track visitation, dwell time, and return rates over time.

Quantify attendance, origin, and business impact before and after major events.

Assess how new transit, zoning, or developments affect foot traffic.

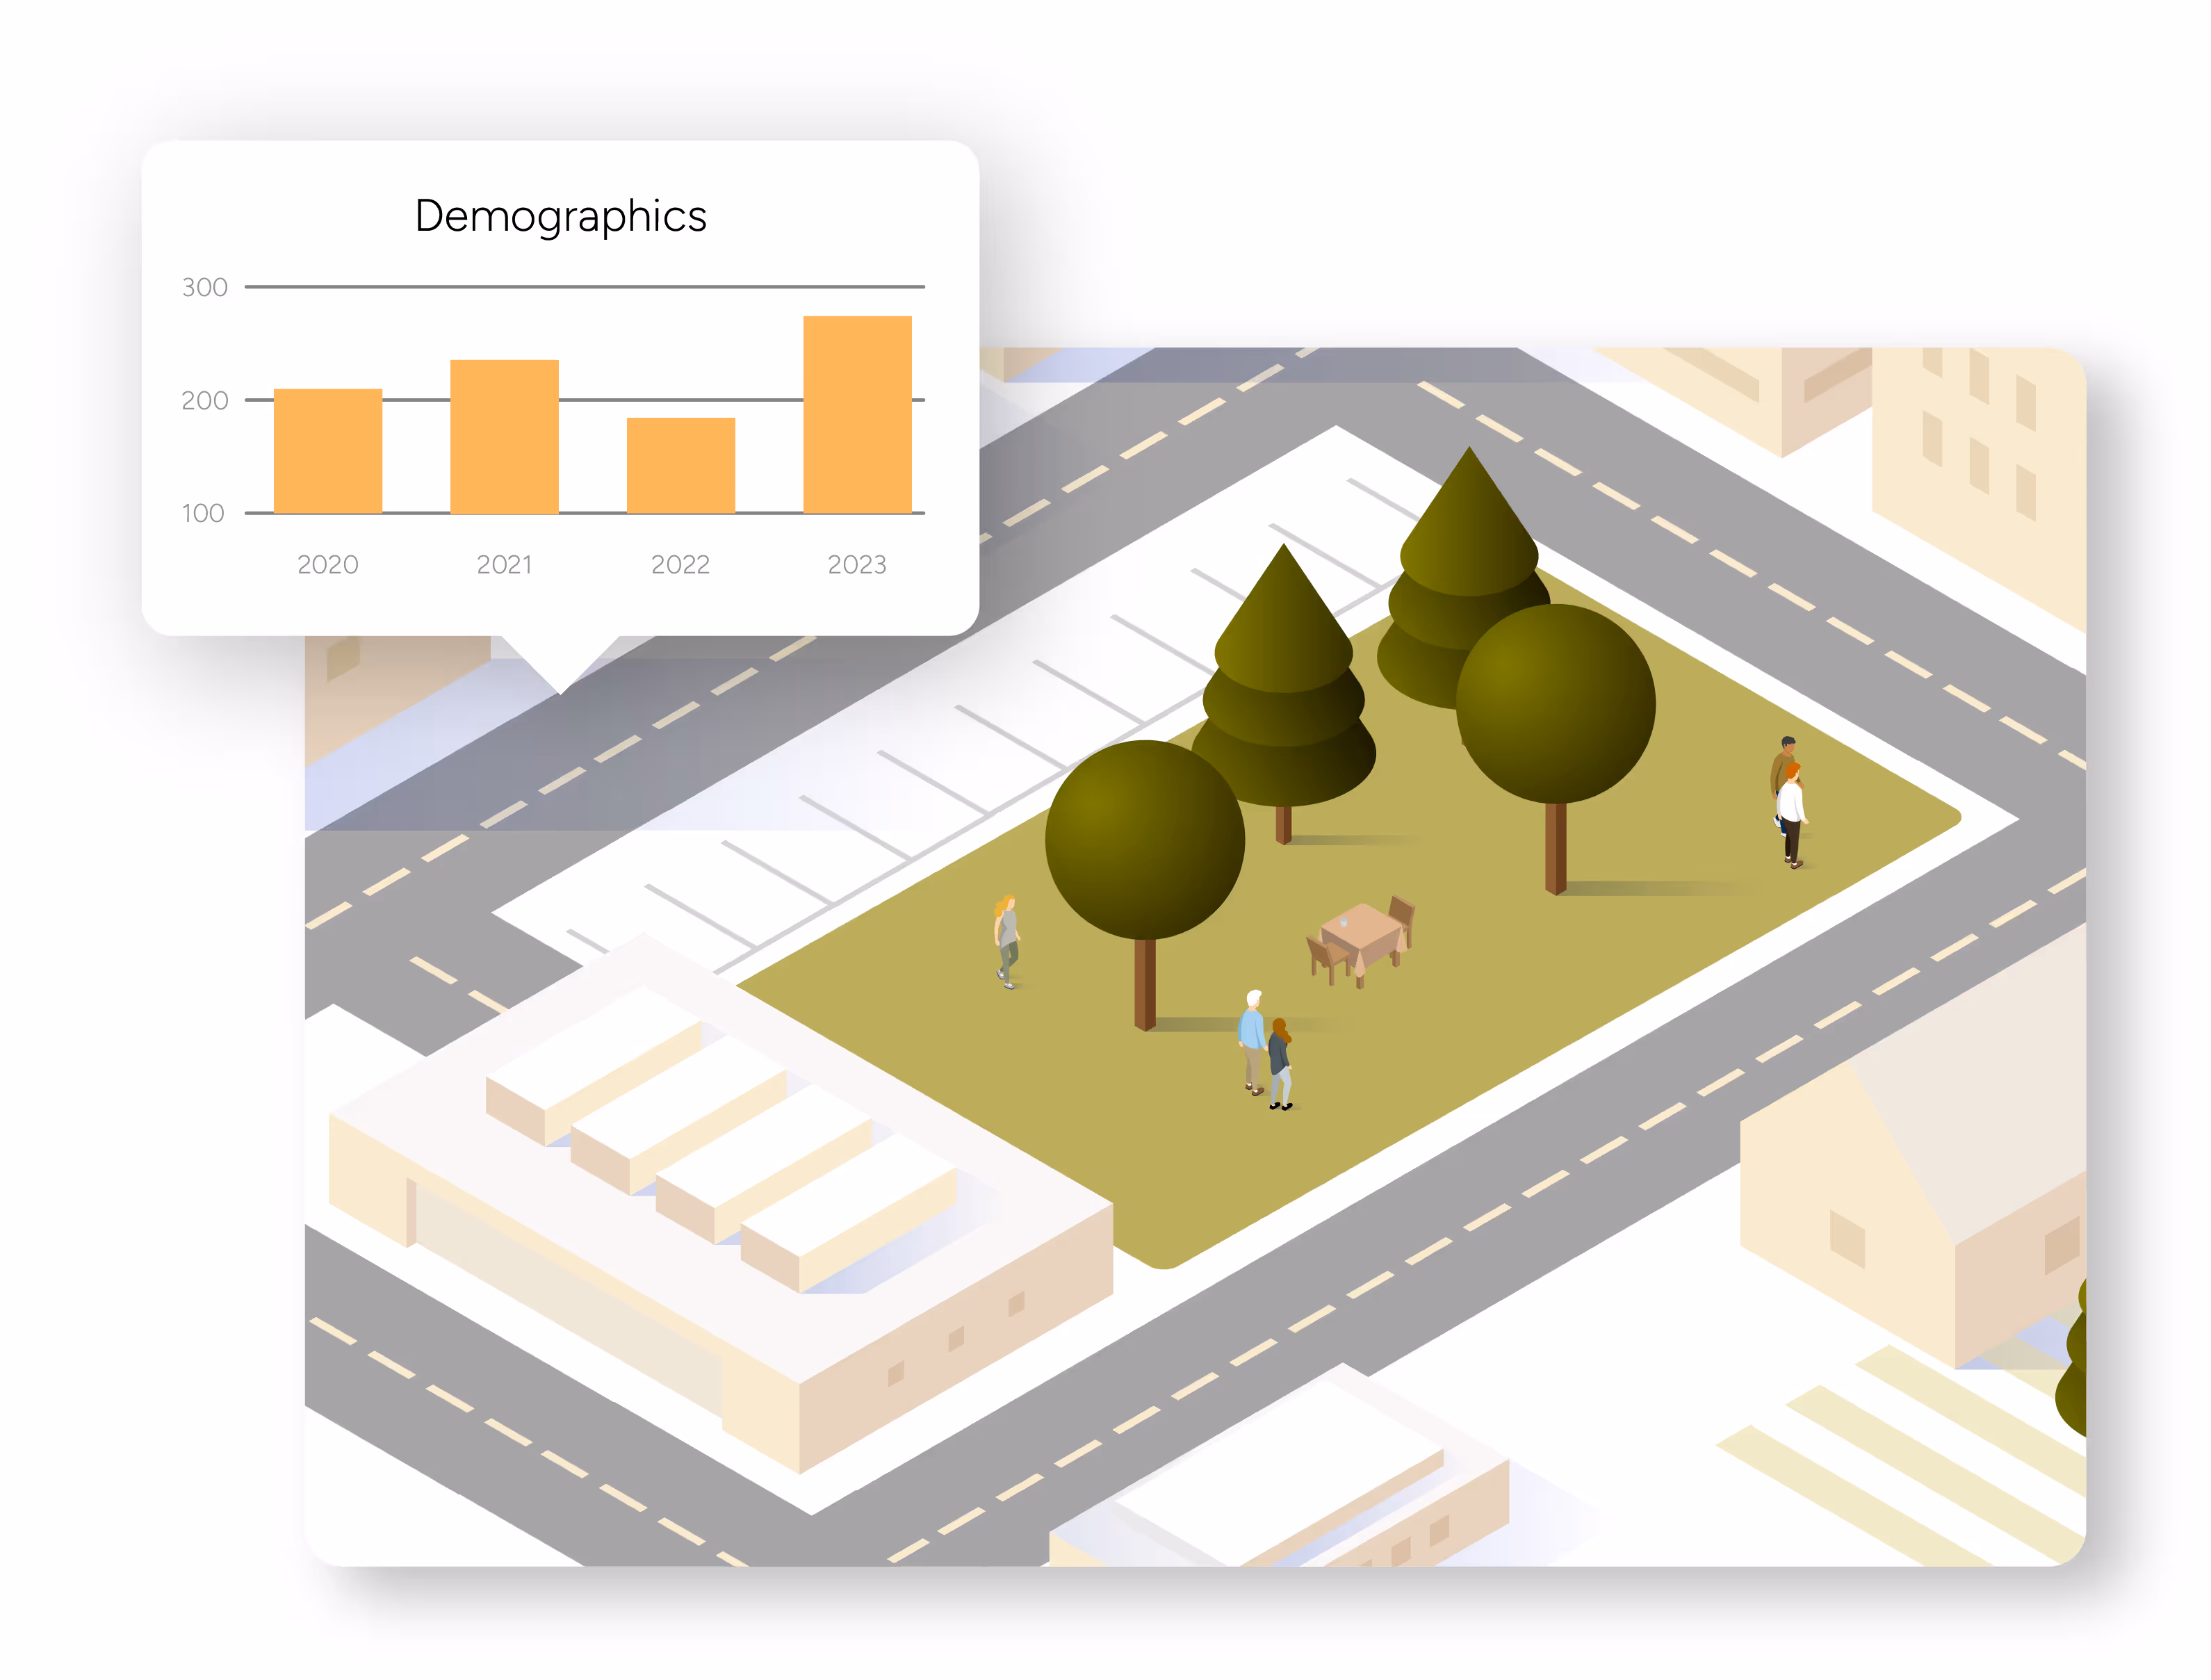
Understand who visits, where they come from, and who is underserved.

Define any district or neighborhood, no GIS experience needed.


Combines mobility, transaction, demographic, and psychographic layers.

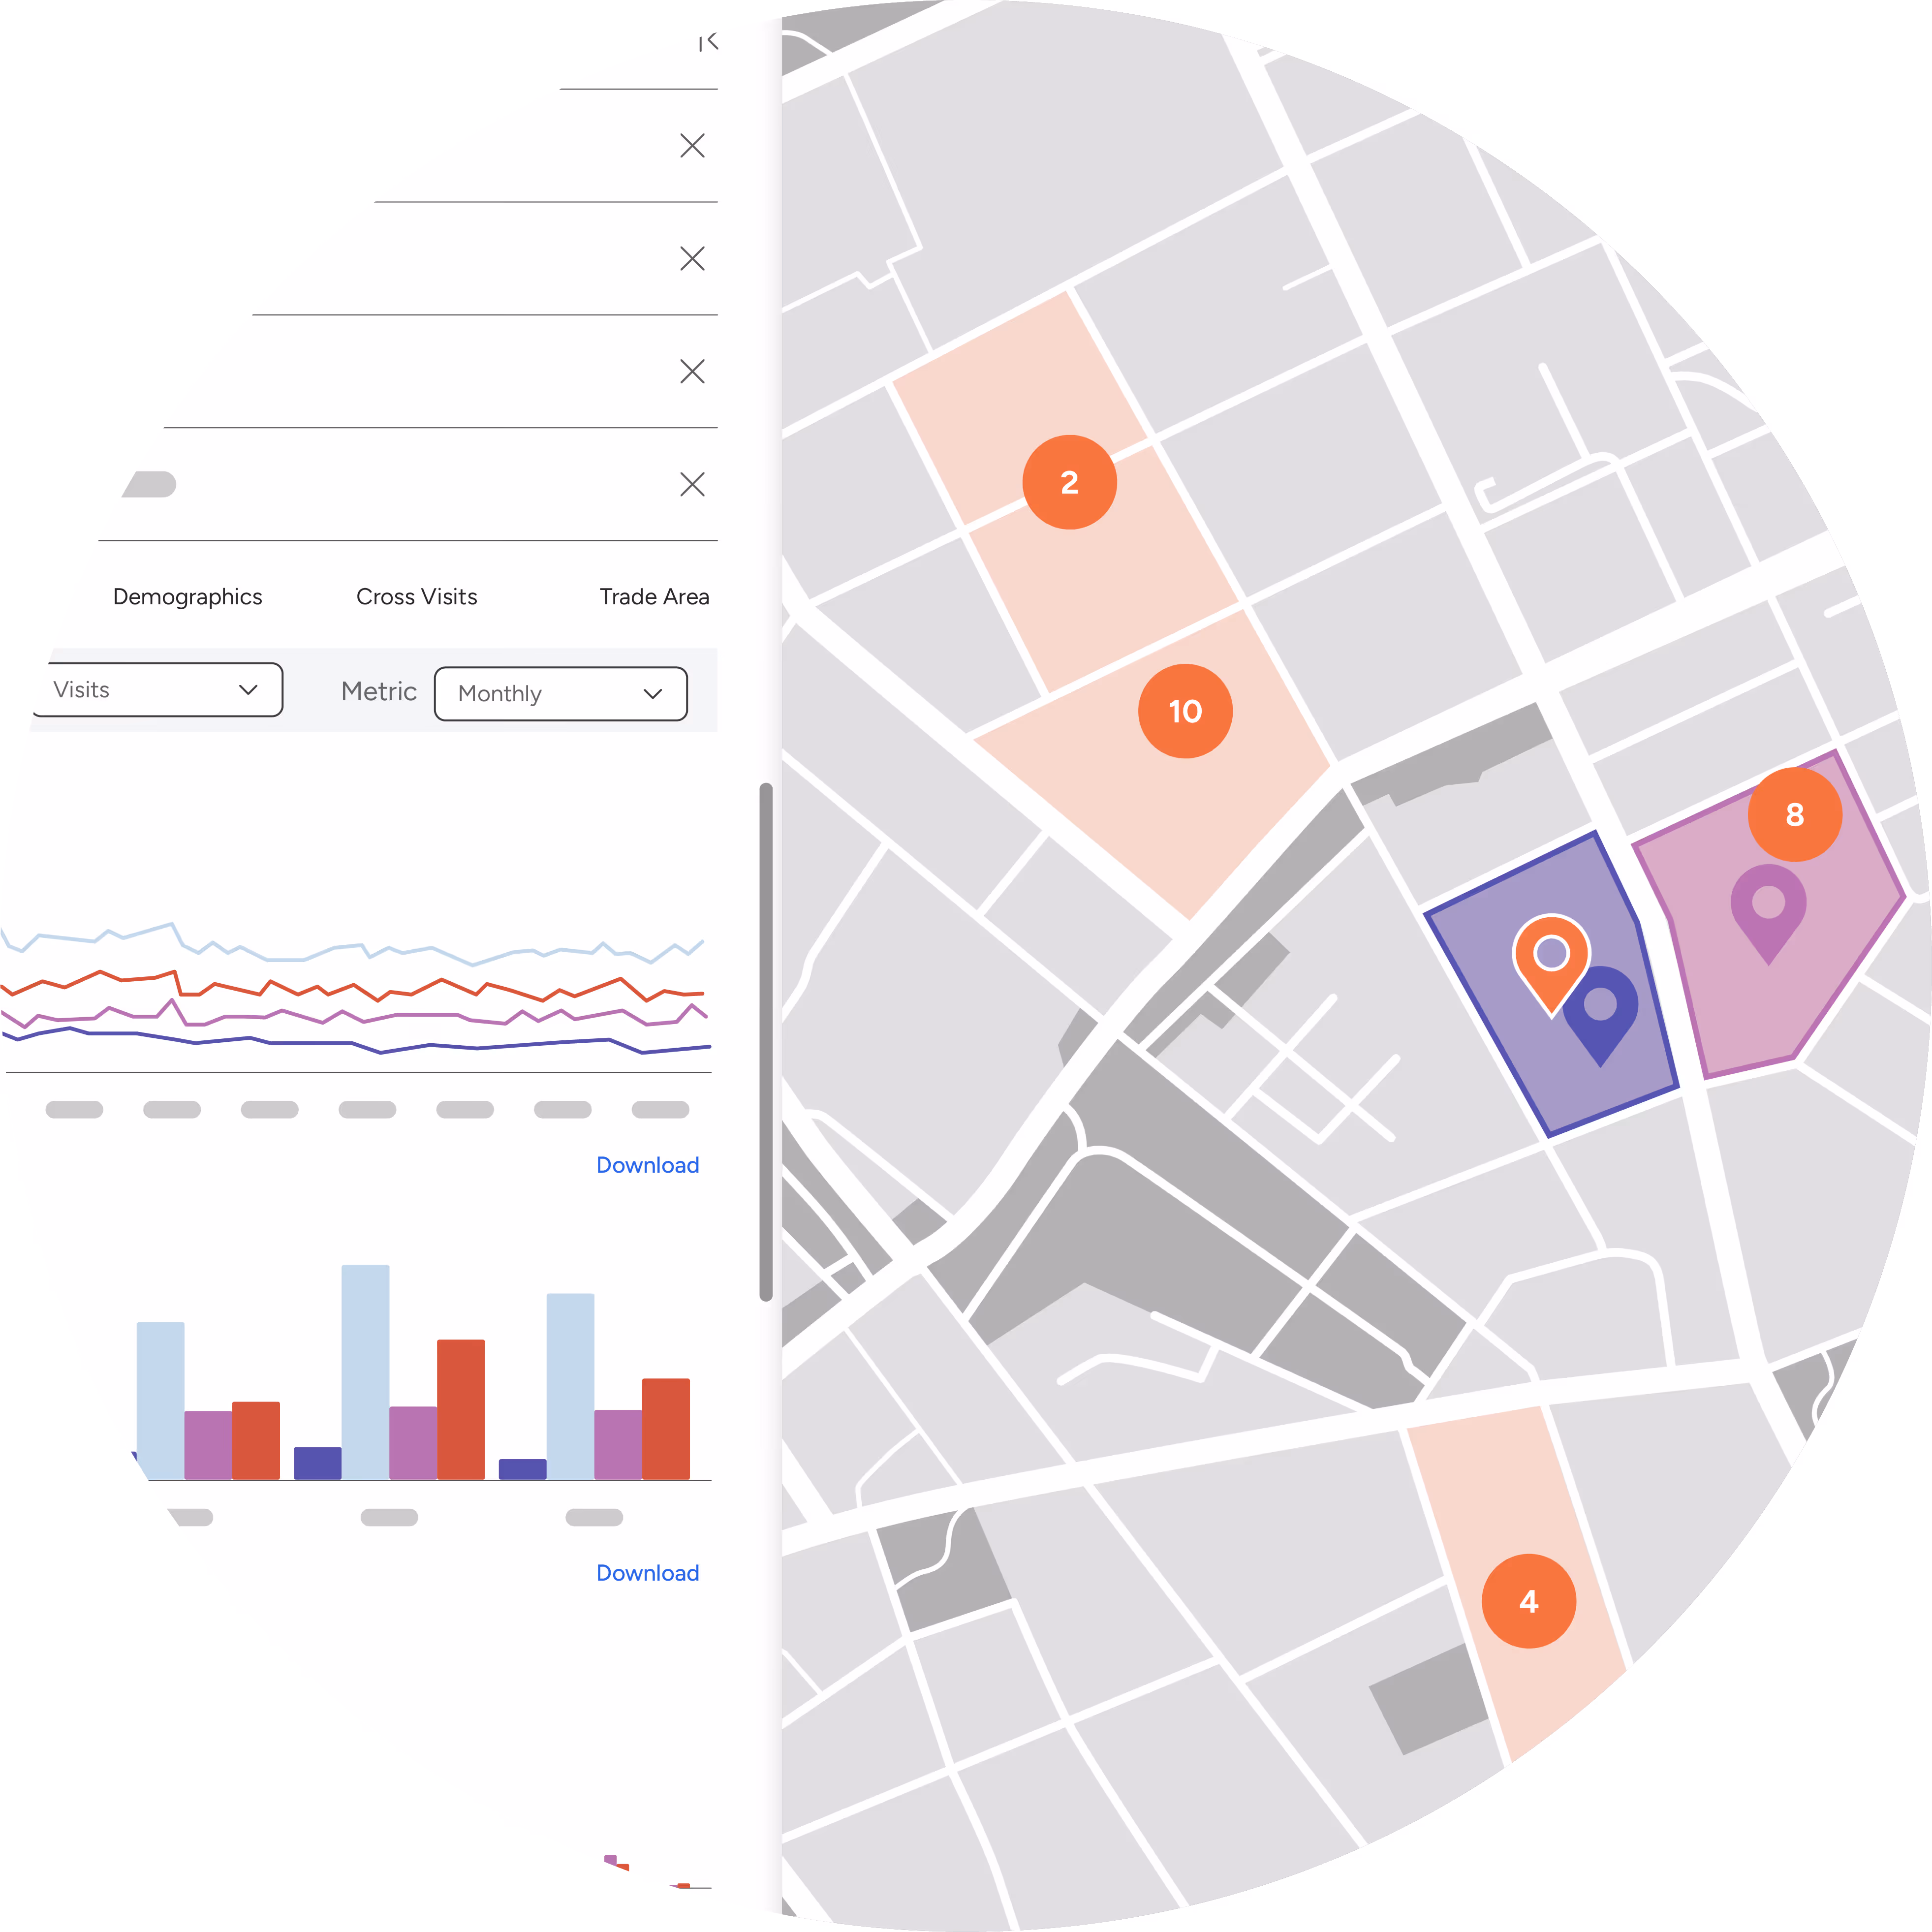
Analyze data by district, zip code, hexcode, or custom hand-drawn boundaries.

Enterprise-grade exports and open data sharing options.

Privacy-compliant and anonymized insights, ensuring data integrity and compliance.

GIS-style tool to view trade areas, tenant health, and property trends across your portfolio.

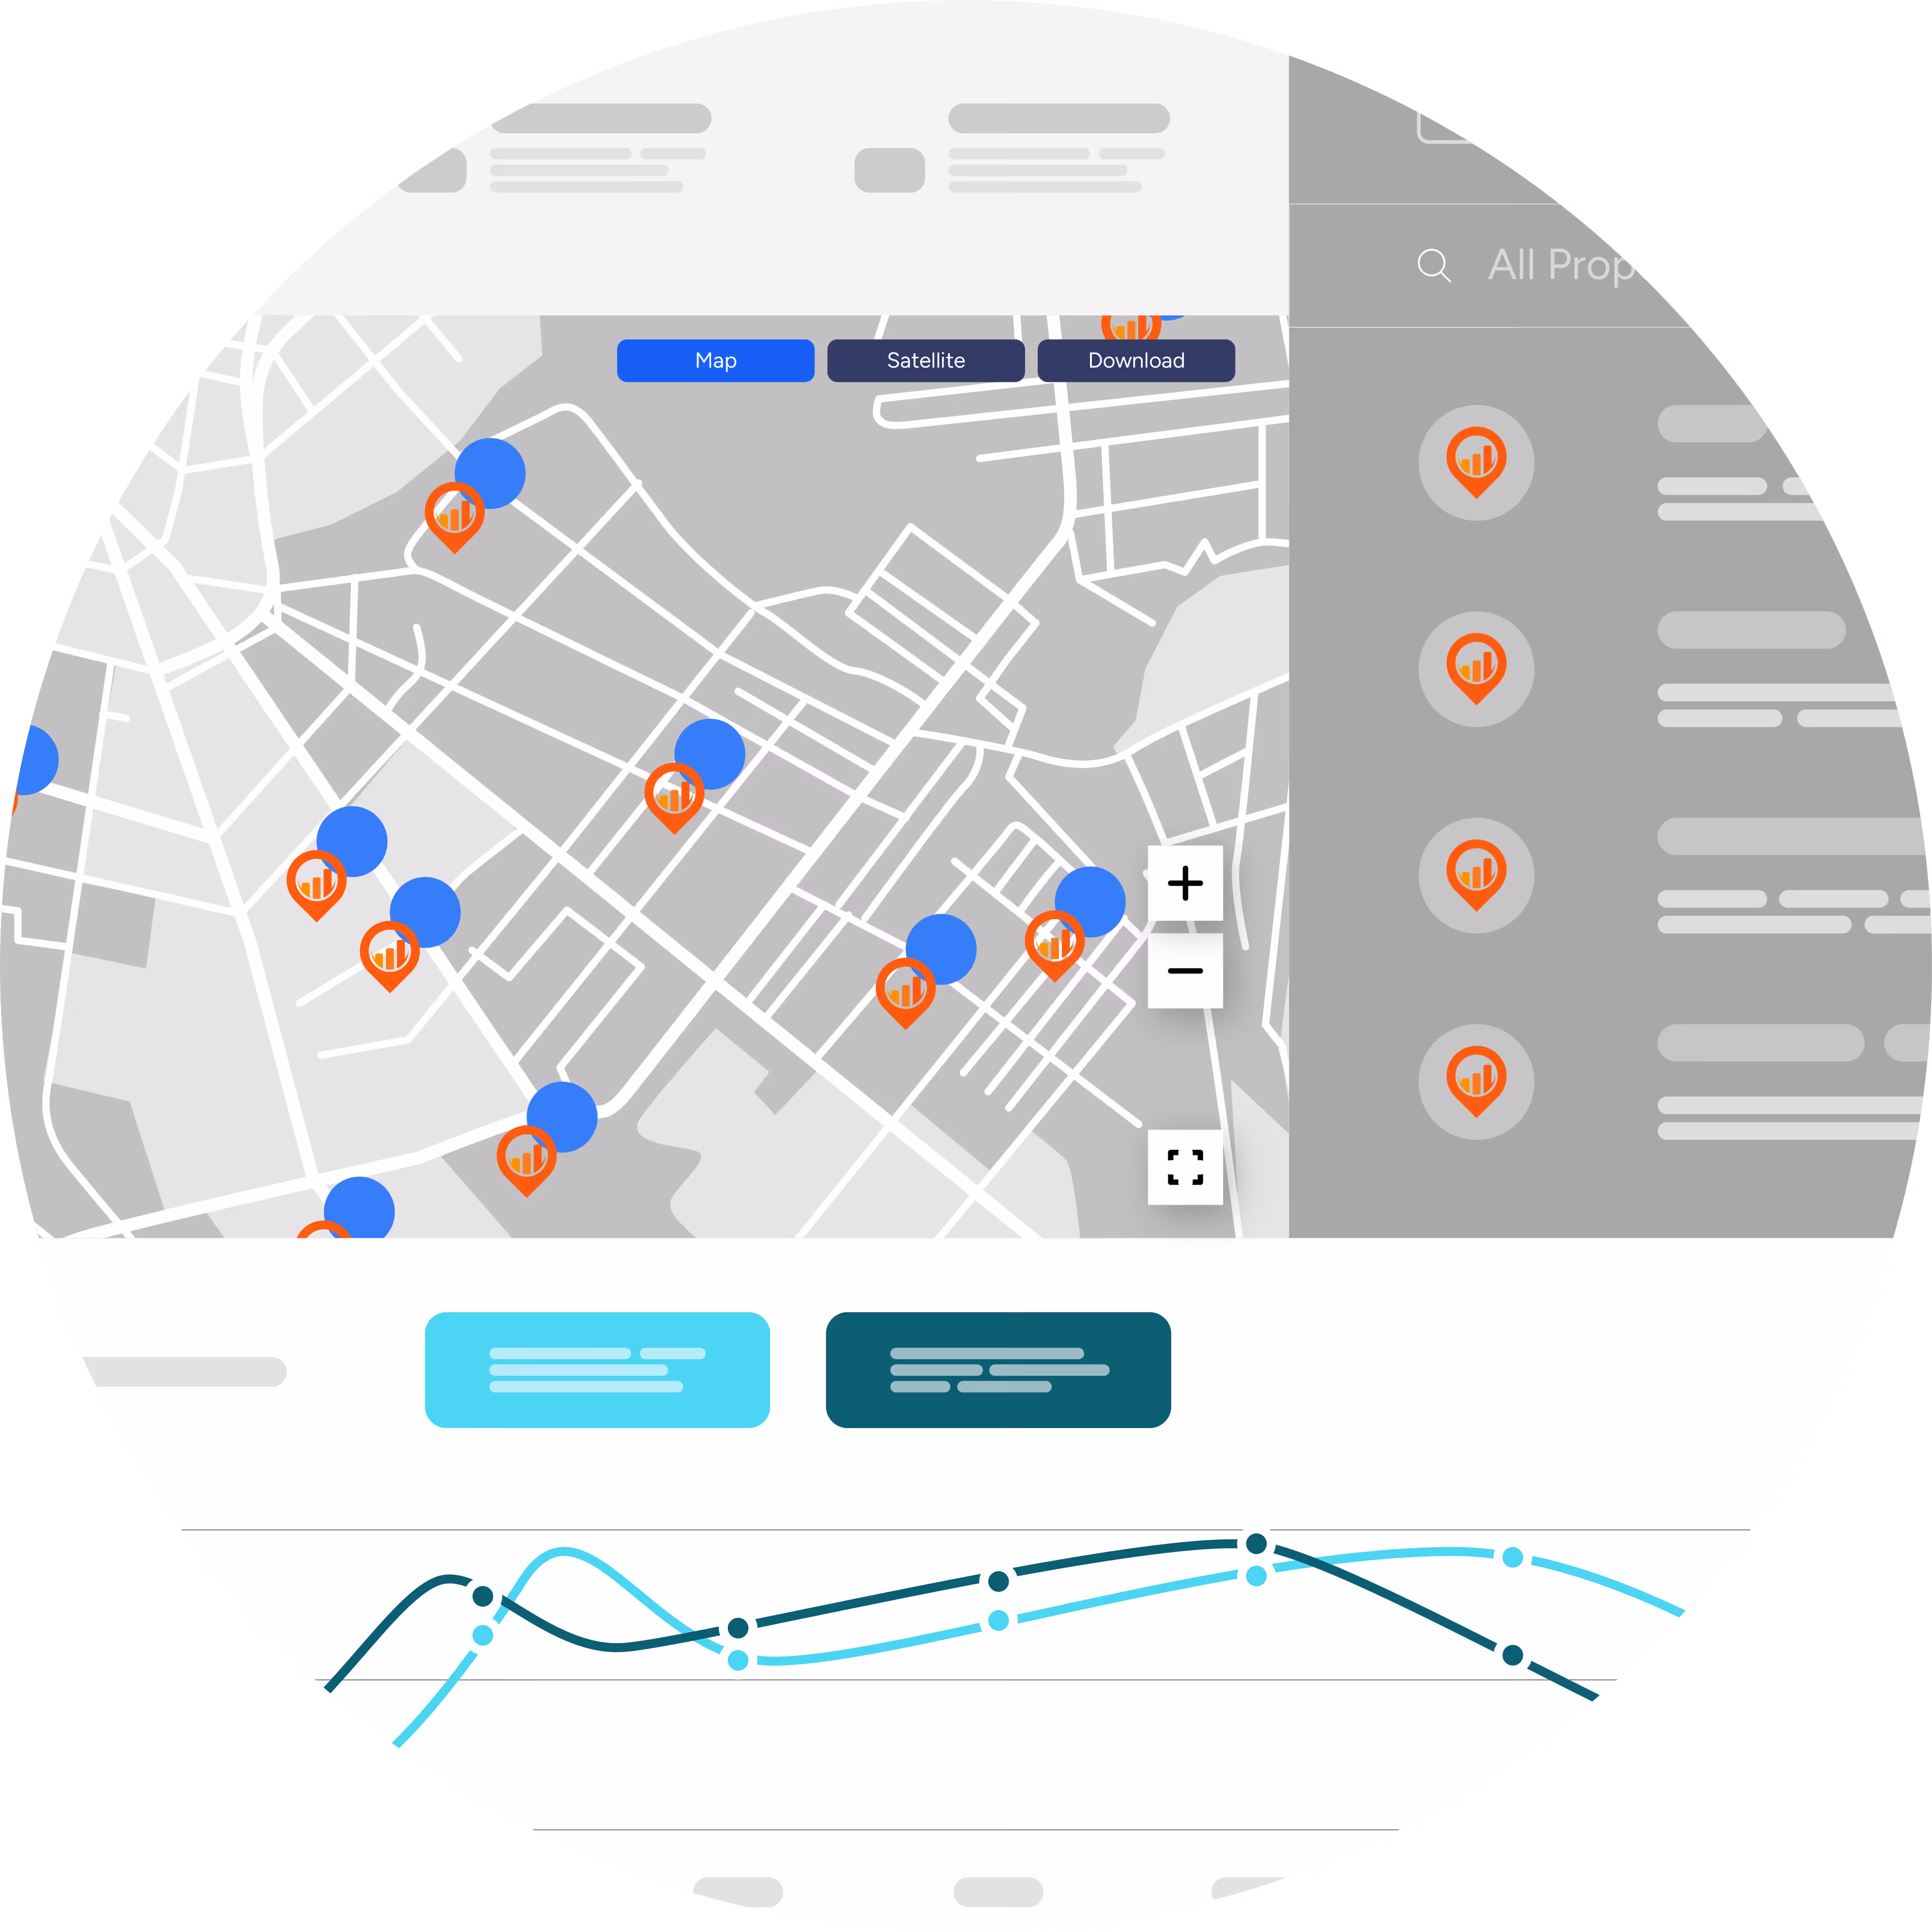
Customizable platform combining foot traffic and transaction data, perfect for portfolio-wide insights and export-ready reporting.
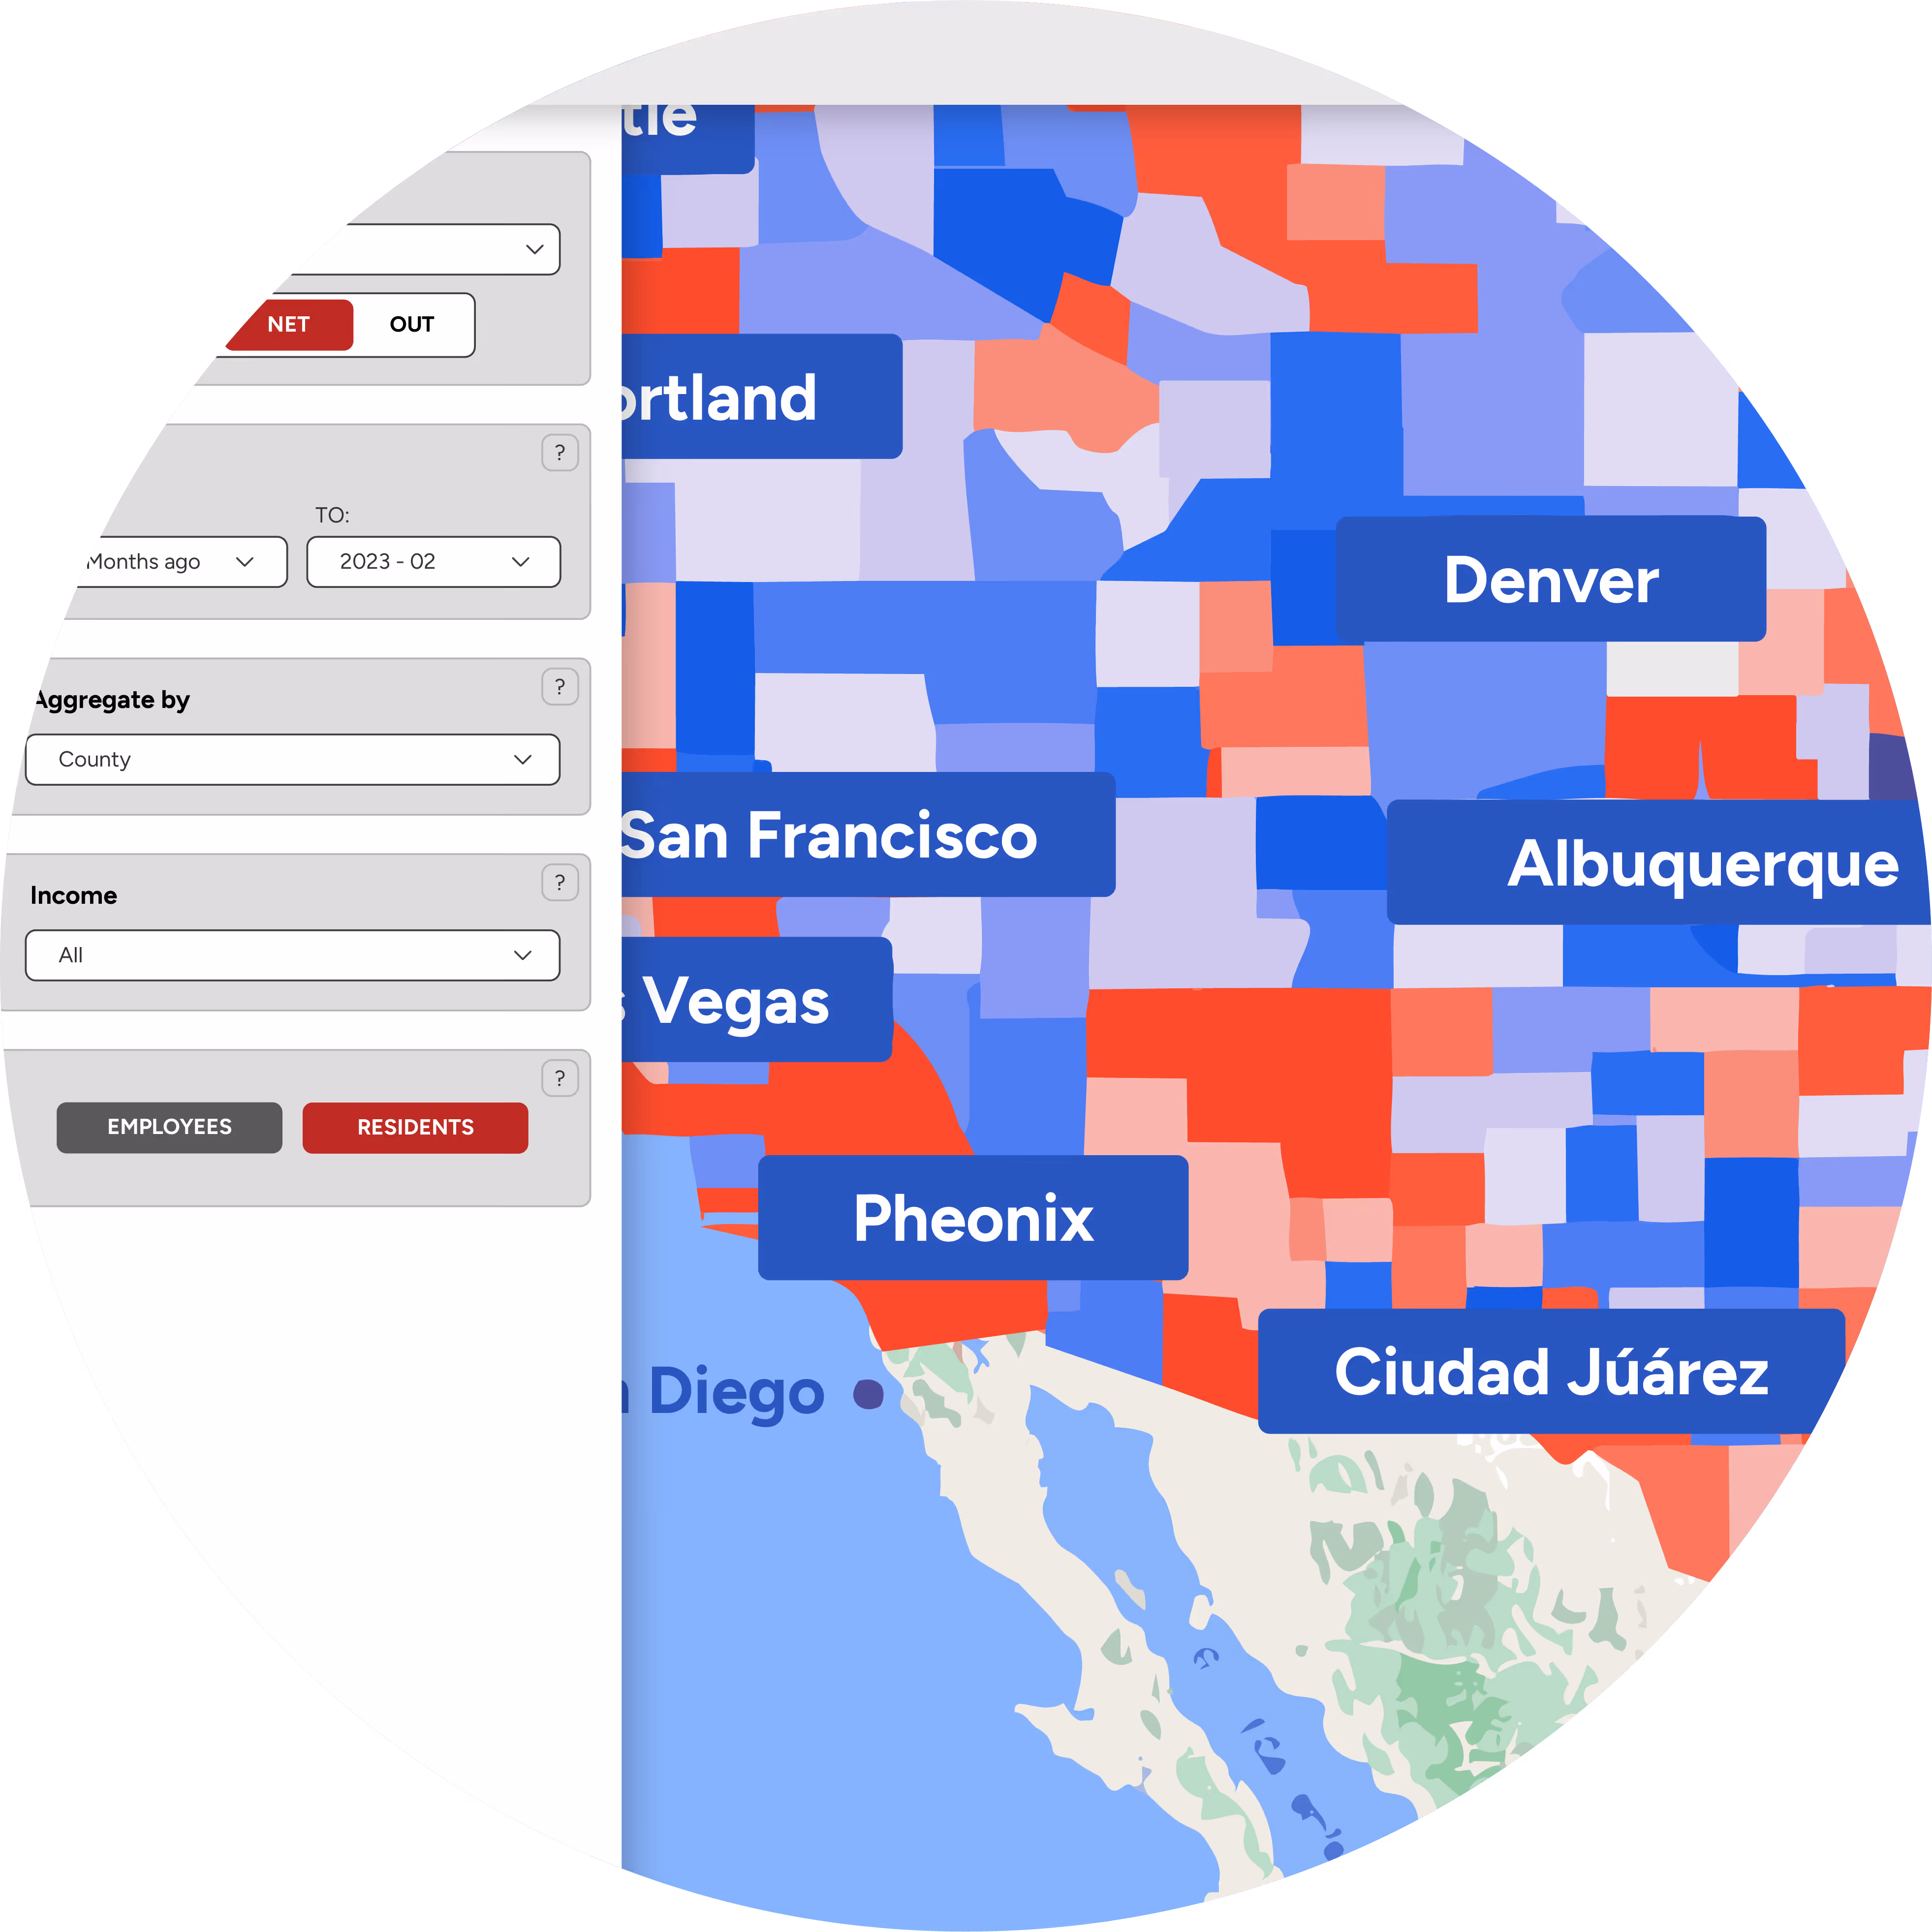

Offers macro trends in migration, commuter shifts, and daytime population changes, supporting long-term transit demand modeling.
Share your details and we'll connect you with an ADVAN specialist to quantify economic vitality, event impact, and visitor demographic across a district or corridor, then set up a custom demo tailored to your goals.
Our data is 95%+ accurate compared to ground truth, verified by tenant data and people counters. We hand-draw over 2 million geofences to ensure location-level precision.
ADVAN provides data on a T+1 basis, which means traffic data from yesterday is available before today’s market opens.
Absolutely. ADVAN only uses anonymized, opt-in mobile data and is fully compliant with GDPR, CCPA, and other major privacy frameworks.
Yes. We offer custom geofencing, tailored reporting, and integrations into your existing systems or tools.
Not at all. We provide intuitive visualizations and analyst support to ensure insights are actionable and digestible.
Yes. We offer custom data feeds and API integrations, so your leasing, research, and investment teams can work with ADVAN data seamlessly.