
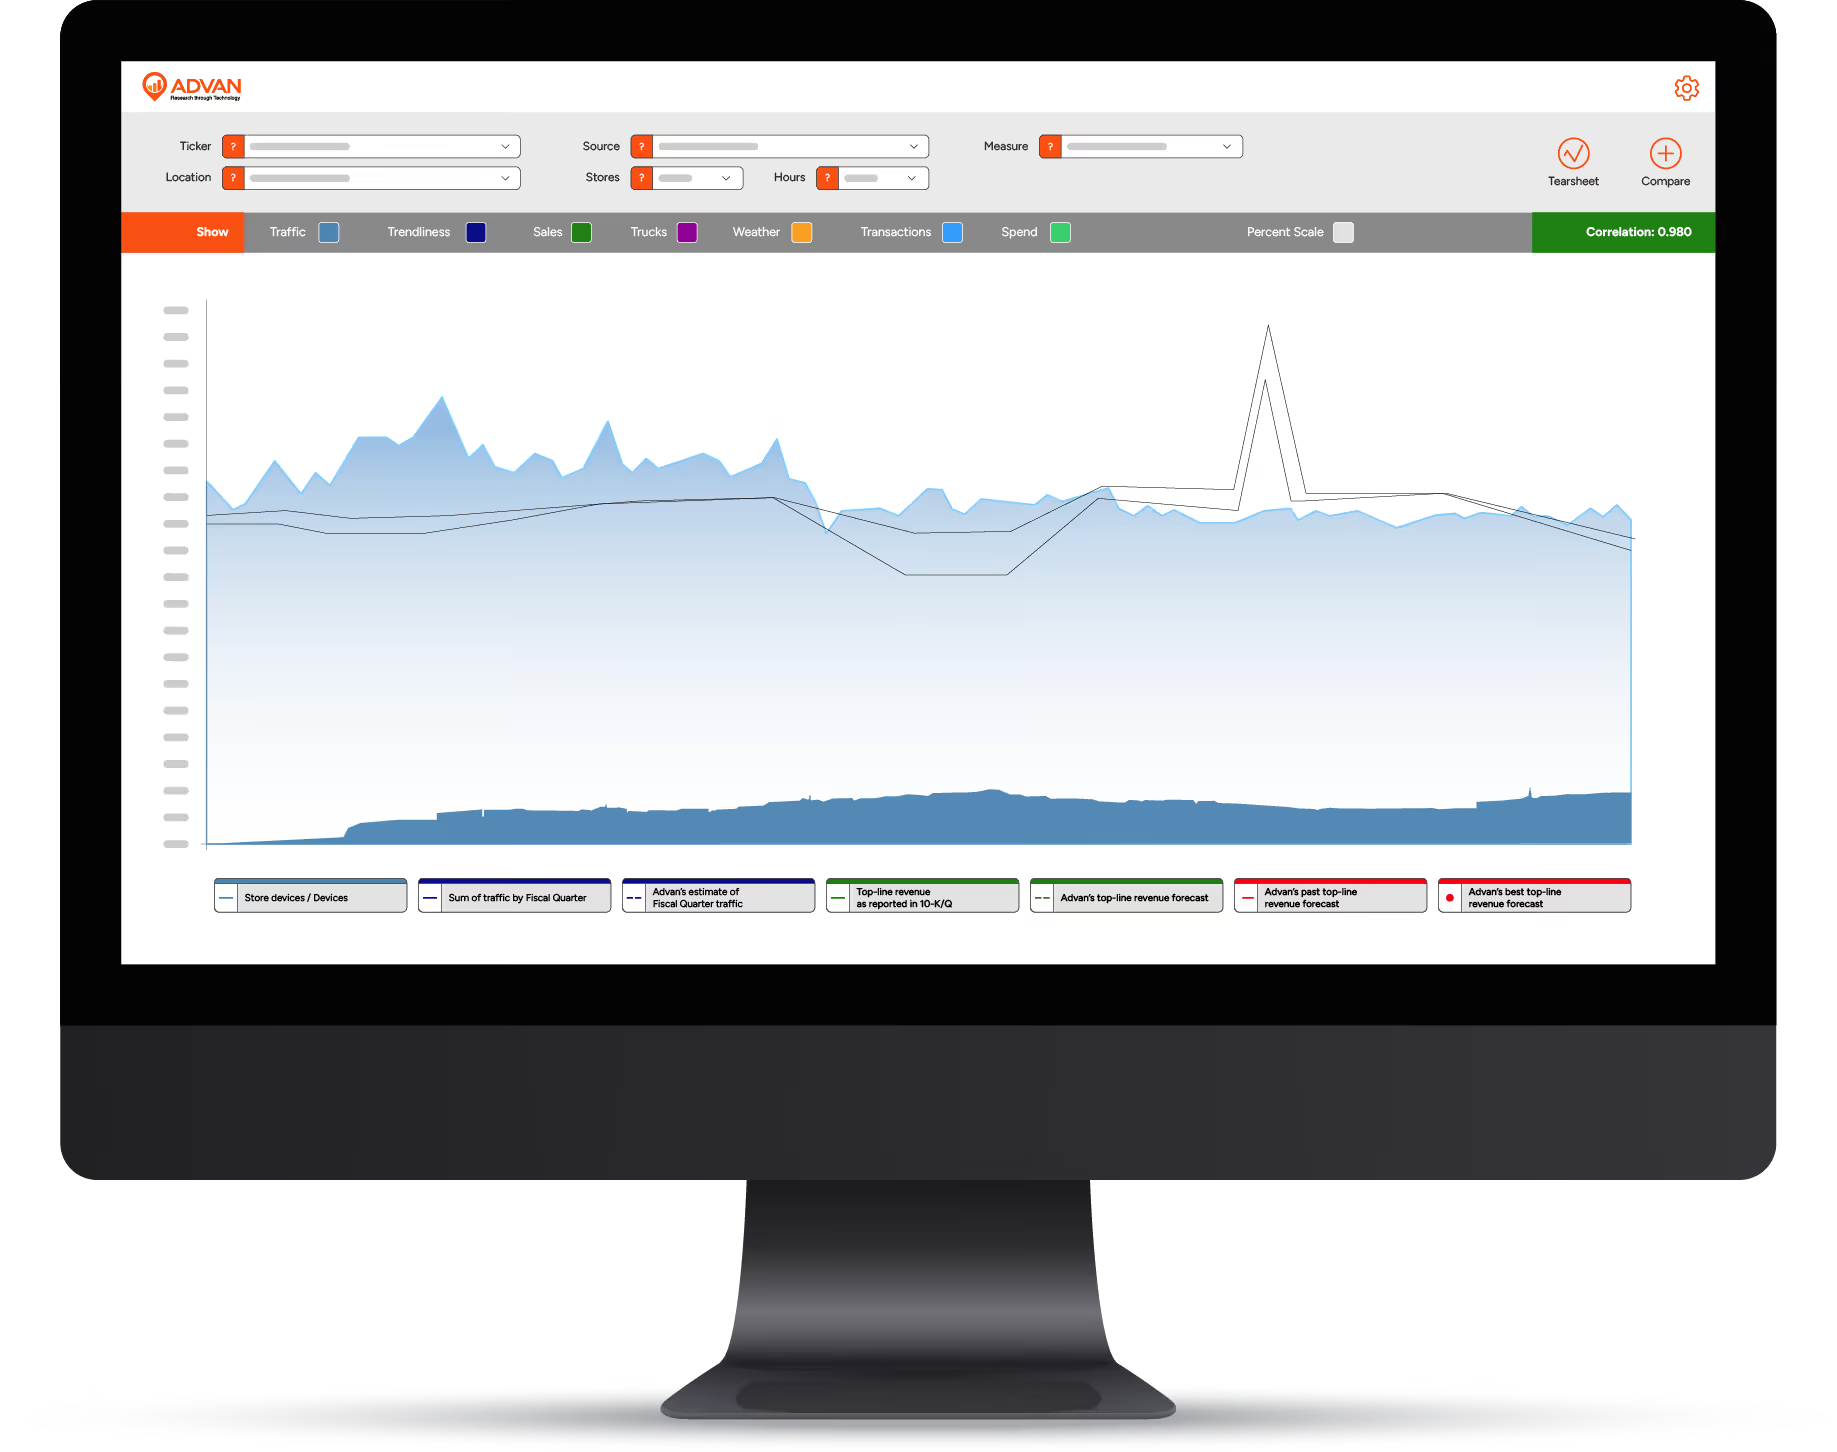


FiT provides T+1 visibility into store-level and sector-level activity, data that traditionally shows up in KPIs, channel checks, or earnings weeks later.

ADVAN’s foot-traffic methods are extensively tested against corporate fundamentals and ground truth data, demonstrating strong correlation to real-world business performance across thousands of companies.

Capture nuances that fundamental research misses; hiring surges, shift reductions, store-format changes, unexpected regional slowdowns, or competitive encroachment.

FiT’s structured, point-in-time datasets are optimized for forecasting, factor modeling, pretrained signals, and statistical back testing at both brand and location levels.
Monitor performance across 10,000+ tickers with daily foot traffic counts, employee presence, and customer activity across thousands of store locations and facilities.
See operational strength or weakness as it happens, often weeks before KPIs or earnings calls reflect it.
Analyze 9M+ POIs at the store, plant, warehouse, mall, casino, or distribution-center level.
Track openings/closures, point-in-time attributes, parking-lot and in-store attendance, and daily workforce shifts.
Track nationwide logistics patterns using data from 50% of all trucks in the U.S. and Canada, giving you real-time visibility into:
See operational strength or weakness as it happens, often weeks before KPIs or earnings calls reflect it.
Monitor foot traffic across 150,000 underlying properties tied to 2,000+ CMBS deals to detect stress, changes in tenant performance, or early-stage recovery patterns.
FiT offers two complementary index frameworks built from billions of daily foot-traffic observations:
1. 300+ sector & industry indices
Activity indices built by grouping all companies operating within the same industry or sector. These capture broad operational momentum, making it easy to see where strength or weakness is forming across themes like casual dining, big-box retail, industrials, healthcare services, logistics, and more.
2. NAICS-based indices (800+ categories)
A second, more granular layer of indices constructed from 800+ NAICS categories. These allow analysts to isolate performance at a finer level, from specific manufacturing segments to niche retail formats, and identify category-level divergences that may not appear in broader sector aggregates.
Together, these high-frequency indices help investors detect macro turning points early, validate or challenge top-down narratives, and understand where economic momentum is accelerating or slowing beneath the surface.
Benchmark traffic across competitors, regions, facility types, or store formats.
Analyze daily foot traffic patterns by state, region, or individual POI to understand what drives underperformance or strength.

Enrich thesis-building with indices covering retail, industrials, restaurants, healthcare, manufacturing, real estate…and many more.

Identify turnarounds, deceleration, cannibalization, store-fleet efficiency, and regional divergences.

Build multi-signal models using daily foot traffic, macro indices, and geospatial relationships.

Track NAICS-level activity to validate macro themes and uncover shifts in real-world momentum.

Detect mall deterioration, tenant strengthening / weakening, or distress signals tied to commercial properties.

Yesterday’s traffic and activity available before today’s market open.

Billions of daily pings across 45M+ U.S. devices, covering thousands of brands and sectors.

All store attributes, geofences, and closures tracked historically for clean back testing.

Designed for hedge funds and asset managers needing clean, stable, predictive alternative data.
Share your details and we'll connect you with an ADVAN specialist for a tour of FiT's ticker analysis, macro dashboards, facility-level activity, and CMBS monitoring.