


Get a real-world view of how much customers are spending, how often they transact, and where those customers come from.

SpendView separates in-store from online sales and highlights customer loyalty and cross-shopping behavior. Reveals trends across markets, brands, and store fleets.

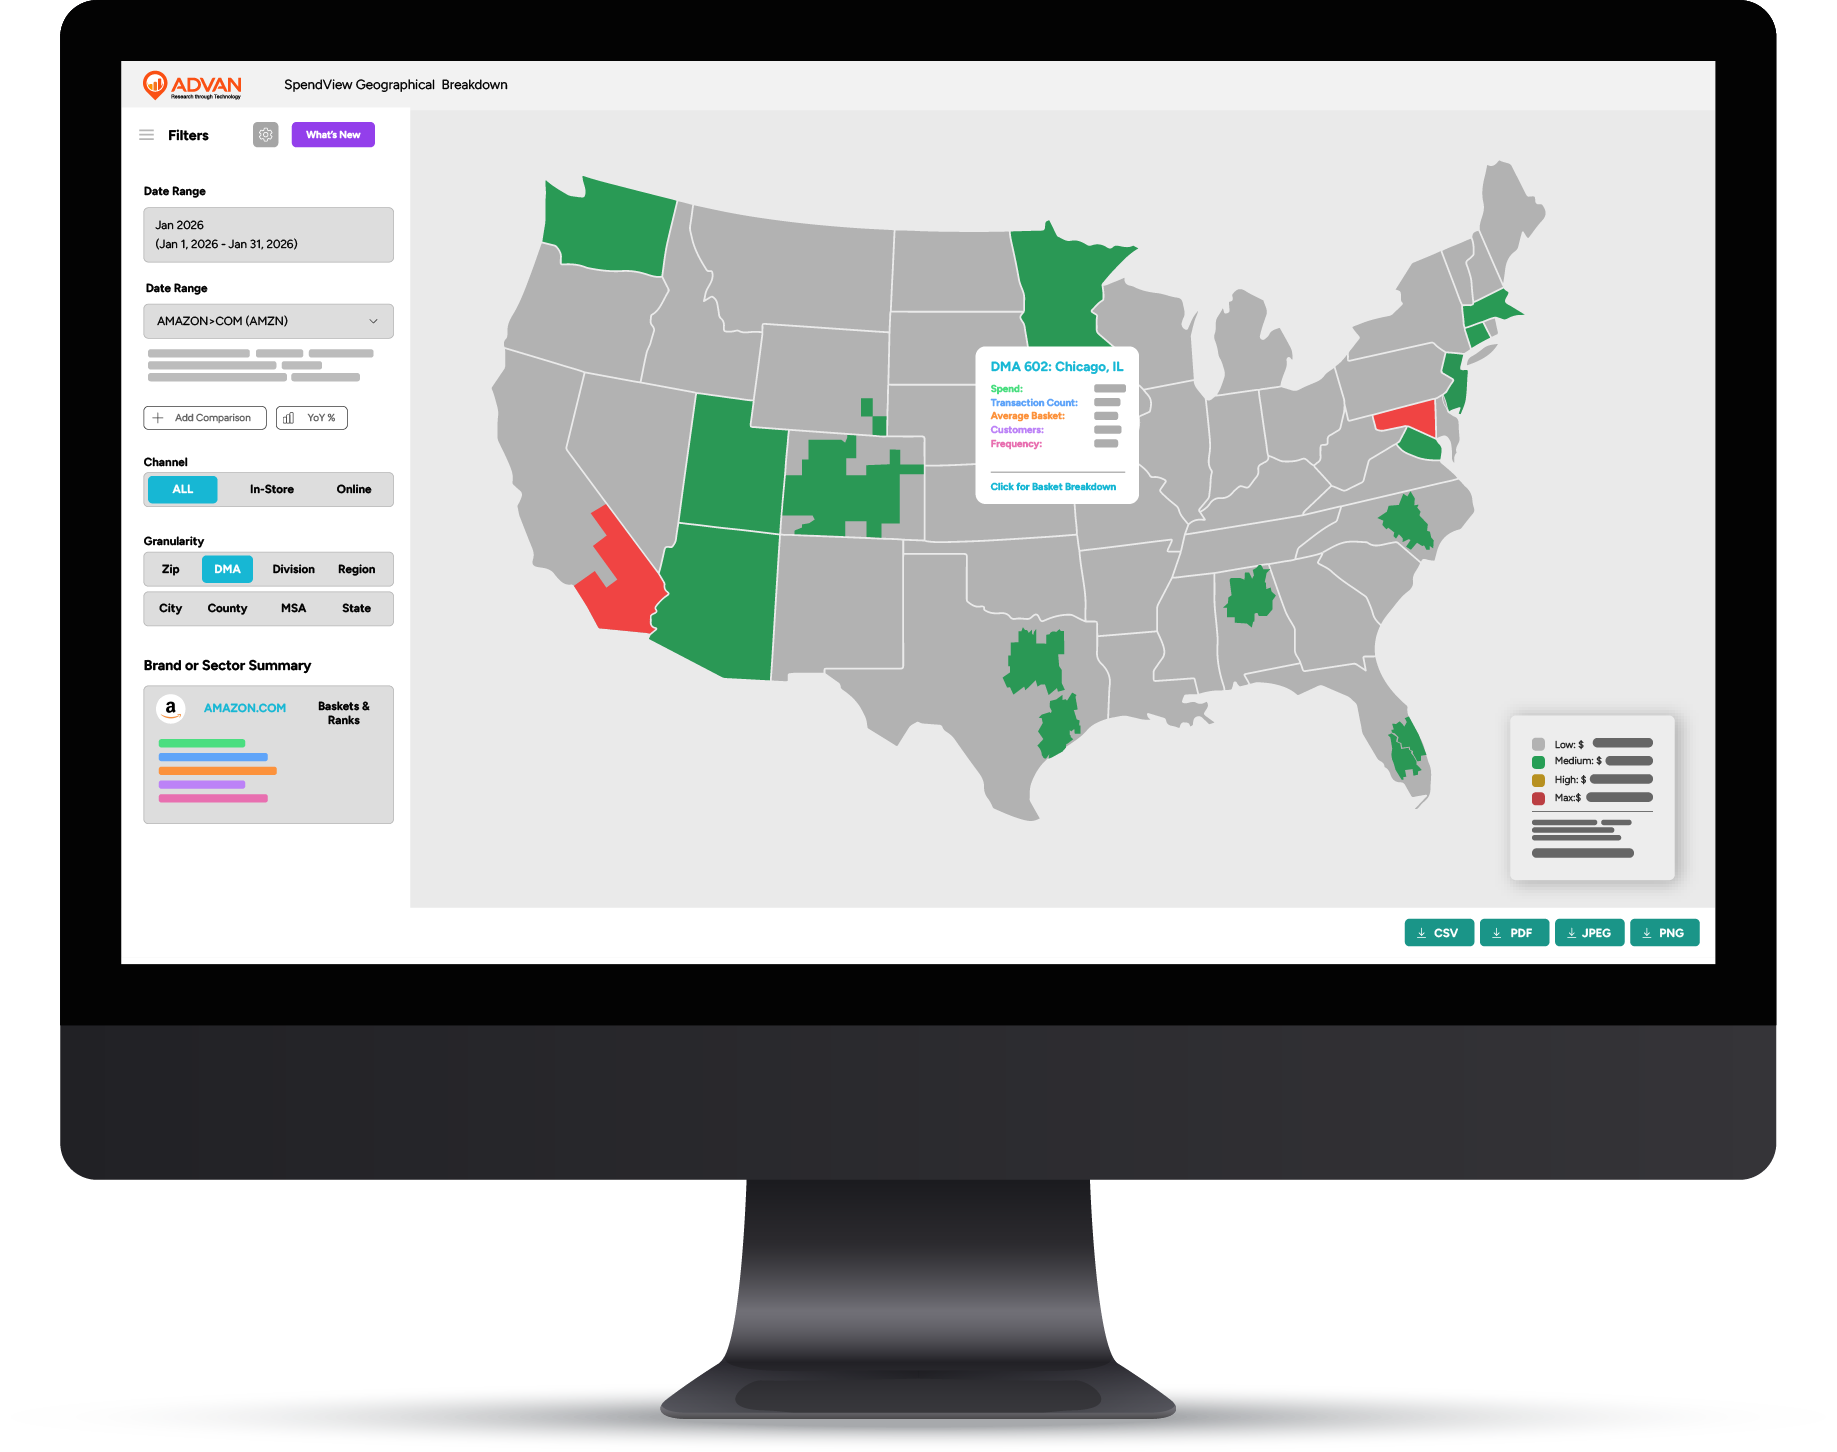
Whether you are evaluating a single store or analyzing an entire sector, SpendView makes it easy to understand performance with precision and context.
See how your competitors are performing. Identify leaders, laggards, emerging threats, and market shifts across regions or store formats.
Understand where customers live, how frequently they shop, what they spend, and which other brands they choose. Reveal loyalty patterns, switching behavior, and cross-brand dynamics.
Use real transaction data to pick winning locations, evaluate white space, avoid cannibalization, and benchmark performance in new or existing markets.
See how each brand ranks within its NAICS or SIC peer group.
Compare stores or brands across spend, transactions, customers, average basket, visit frequency, and online vs in-store channels.
Create rankings over any time period, from a single day to YTD or TTM, and export full tables to CSV for deeper analysis.
Track spending behavior at the industry, category, or regional level. Spot early inflection points and shifts in consumer momentum.

110M+ cards in panel (about 15% of U.S. adults).

5000+retailers.

650K+tagged brick-and-mortar locations.

40B+transactions.

History since 2019.

Weekly updates for timely insights.

A dedicated interface for transaction analytics.

Integrated transaction and foot traffic insights for CRE and retail.

SpendView metrics available when relevant to a POI.

Direct Data Delivery.
Share your details and we'll connect you with an ADVAN specialist to discuss your goals and set up a custom demo tailored to the brands, stores, and channels you cover.