


Access daily, T+1 foot traffic data across 150M+ U.S. rooftops and 10M manually curated POIs. Structured across 800+ NAICS classifications, 300+ sectors, and 10,000+ tickers for complete cross sector visibility.

Track issuer, sector, and regional momentum to anticipate earnings surprises, store level performance and market slowdowns, weeks before earnings.

From retail, REITs, and logistics to industrials, healthcare, and TMT, ADVAN data is NAICS-tagged and sector-normalized, integrating seamlessly into financial and real estate models.

Track employees, trucks, dwell time, and elevation adjusted site activity to understand both supply and demand.

Quantify exposure by geography or asset type; identify over- or underperforming tickers to rebalance on time.

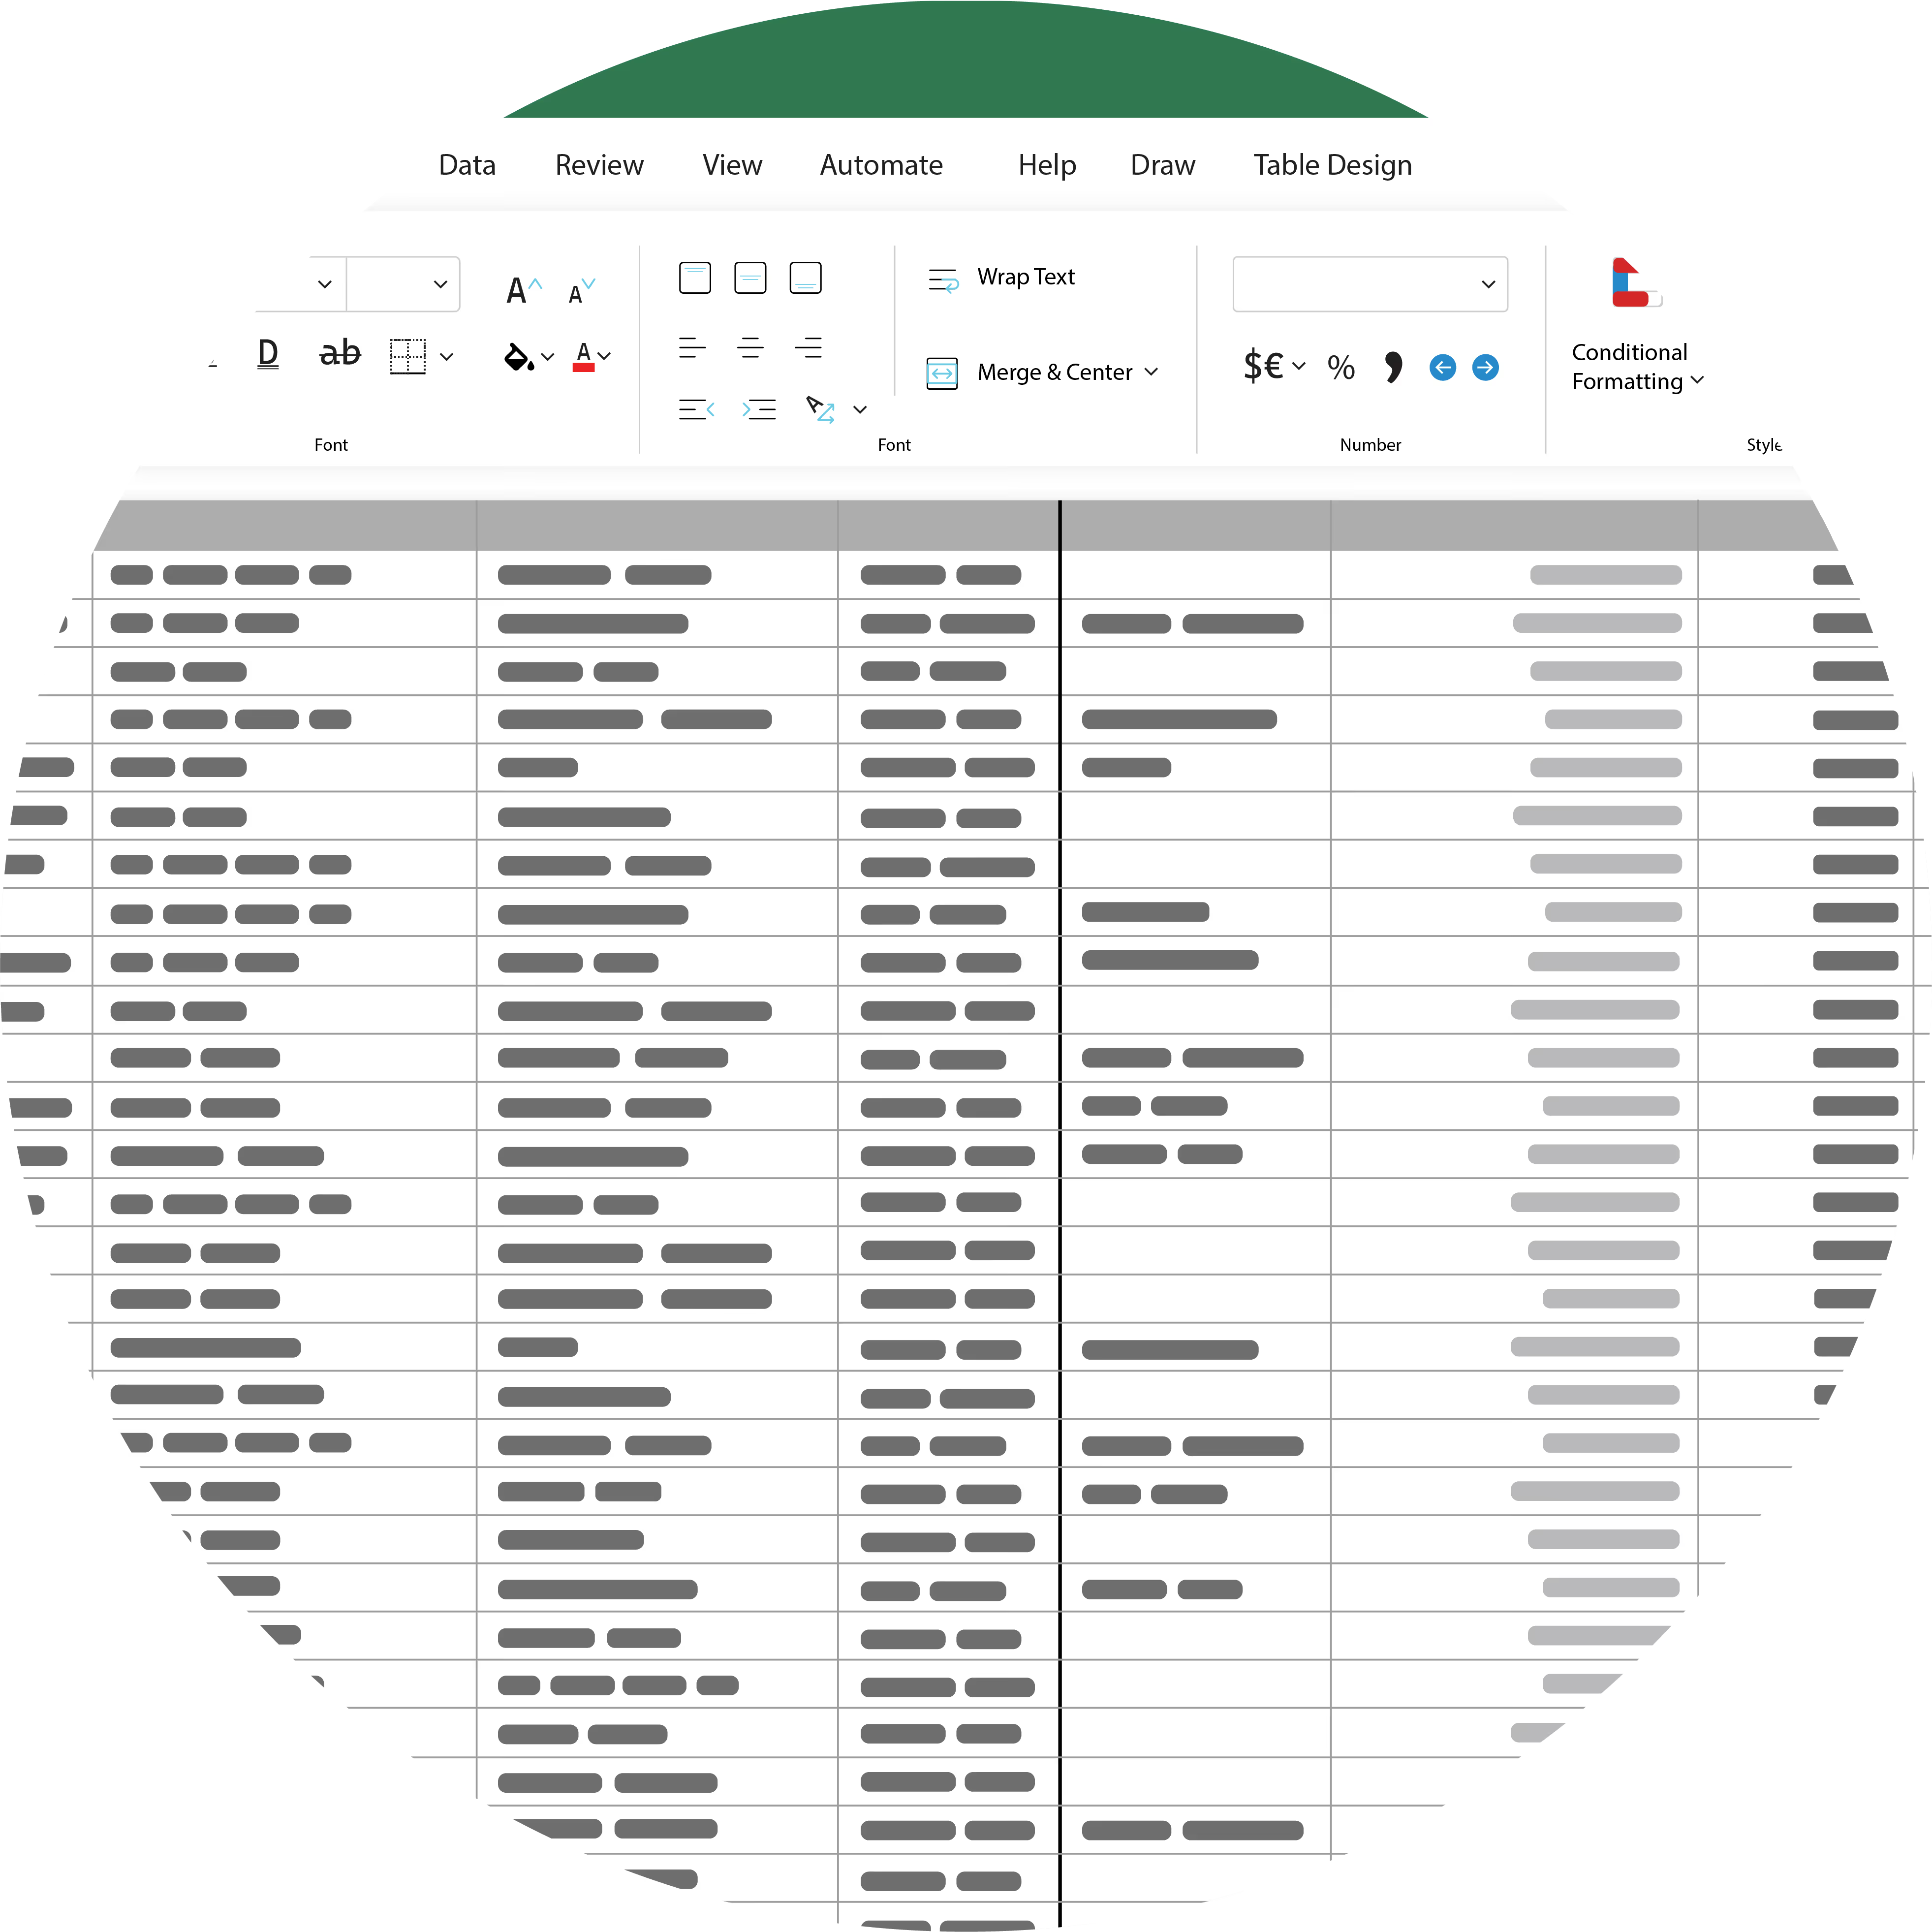
Delivered via AWS S3, GCS, or API, or visualized through our browser-based platform, enabling analysts to benchmark, filter, and export insights instantly.

Proven 95%+ correlation with issuer revenue and other KPIs. Supported by over 10 years of history.

All CMBS deals mapped to Intex, with real-time occupancy and truck traffic metrics. Monitor tenant activity, leasing health, and stress across loans, pools, and assets.


Tens of millions of anonymized devices ensure statistically balanced coverage across the U.S., Canada and Europe. Proprietary normalizations eliminate geographic and demographic bias.

Refreshed daily (T+1). Manually geofenced locations and curated point-in-time datasets with persistent identifiers.

Data feeds for quantitative teams. UIs for fundamental analysts.

Signals have historically beaten sell side analyst consensus 70% of the time.

S3, GCS, and API delivery with secure governance.

Aligned with reported KPIs and securitized asset metrics. All CMBS deals mapped to Intex with occupancy and truck-traffic analytics.
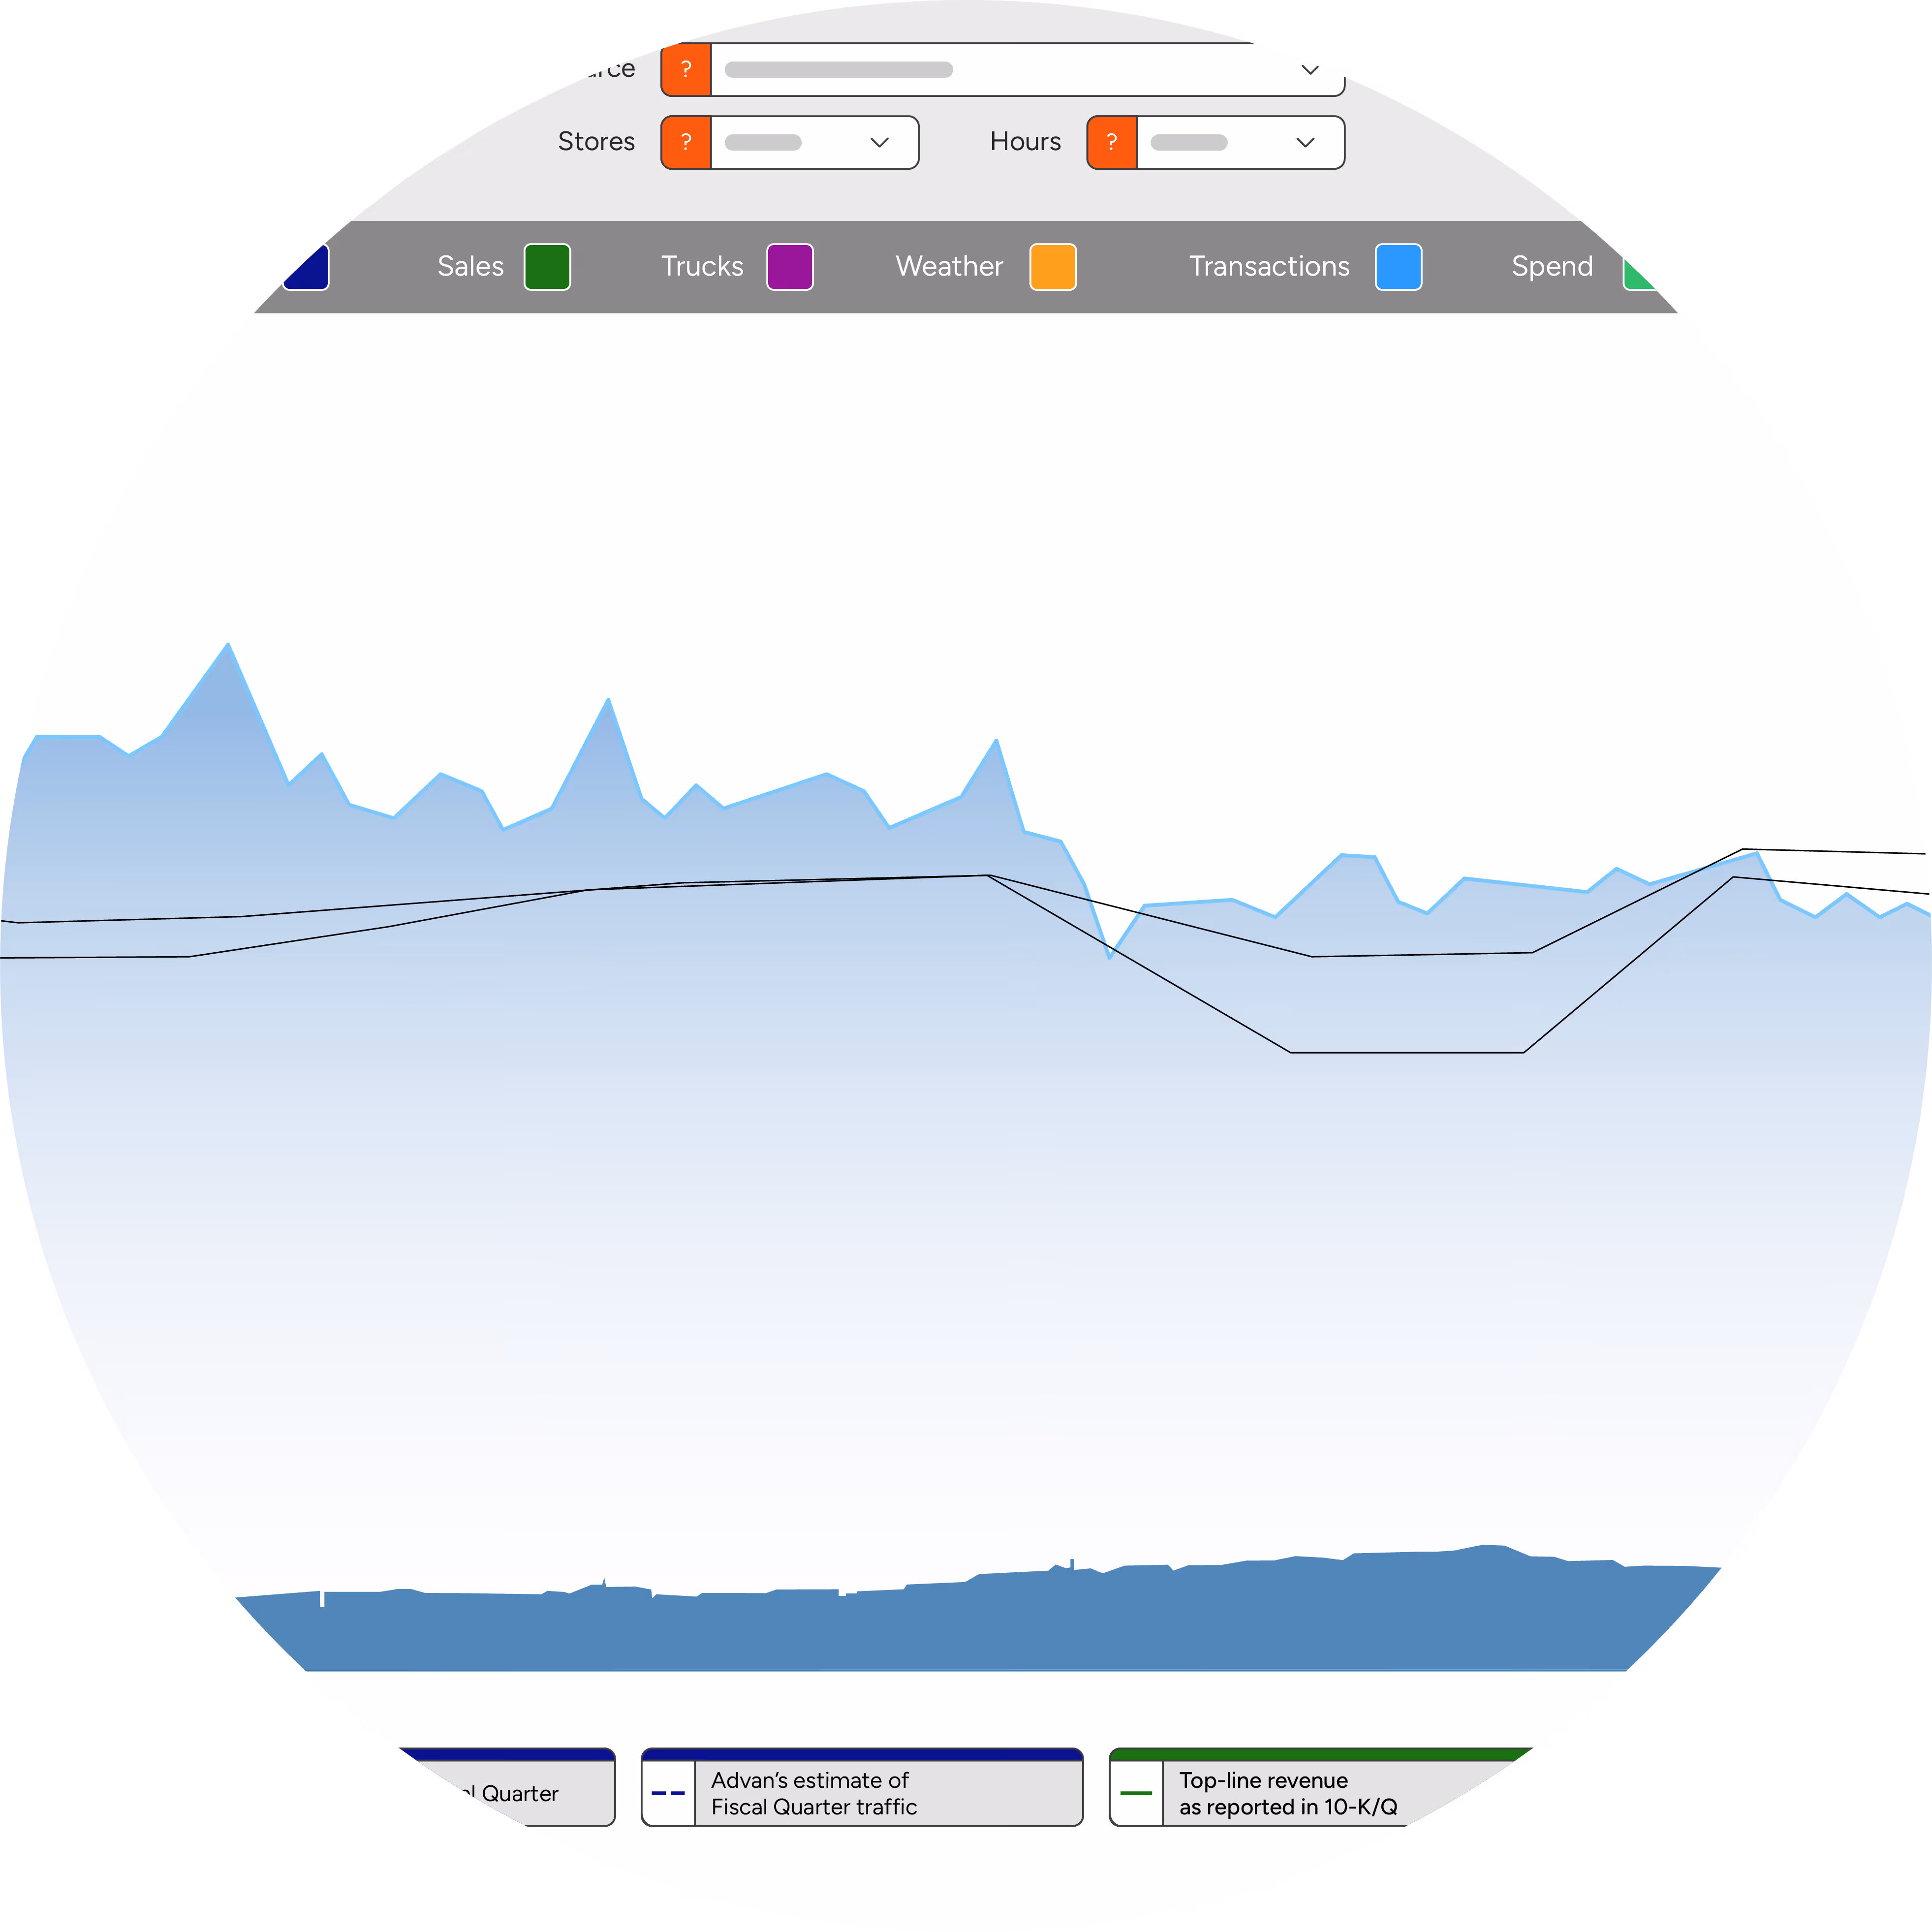

Interactive foot traffic analytics dashboard that visualizes site activity, portfolio trends, and tenant performance.

High-fidelity, T+1 foot traffic dataset normalized across 150M+ rooftops, perfect for backtesting models and detecting early shifts in consumer or tenant behavior.
Share your details and we'll connect you with an ADVAN specialist to map T+1 signals to your coverage, including tickers, sectors, and CMBS exposure, and set up a custom demo.
Our data is 95%+ accurate compared to ground truth, verified by tenant data and people counters. We hand-draw over 2 million geofences to ensure location-level precision.
ADVAN provides data on a T+1 basis, which means traffic data from yesterday is available before today’s market opens.
Absolutely. ADVAN only uses anonymized, opt-in mobile data and is fully compliant with GDPR, CCPA, and other major privacy frameworks.
Yes. We offer custom geofencing, tailored reporting, and integrations into your existing systems or tools.
Not at all. We provide intuitive visualizations and analyst support to ensure insights are actionable and digestible.
Yes. We offer custom data feeds and API integrations, so your leasing, research, and investment teams can work with ADVAN data seamlessly.