


Global POIs; US depth across 150M+ rooftops and 10M ADVAN-branded POIs (8,000+ brands).

In-brand, nationwide, or MSA.

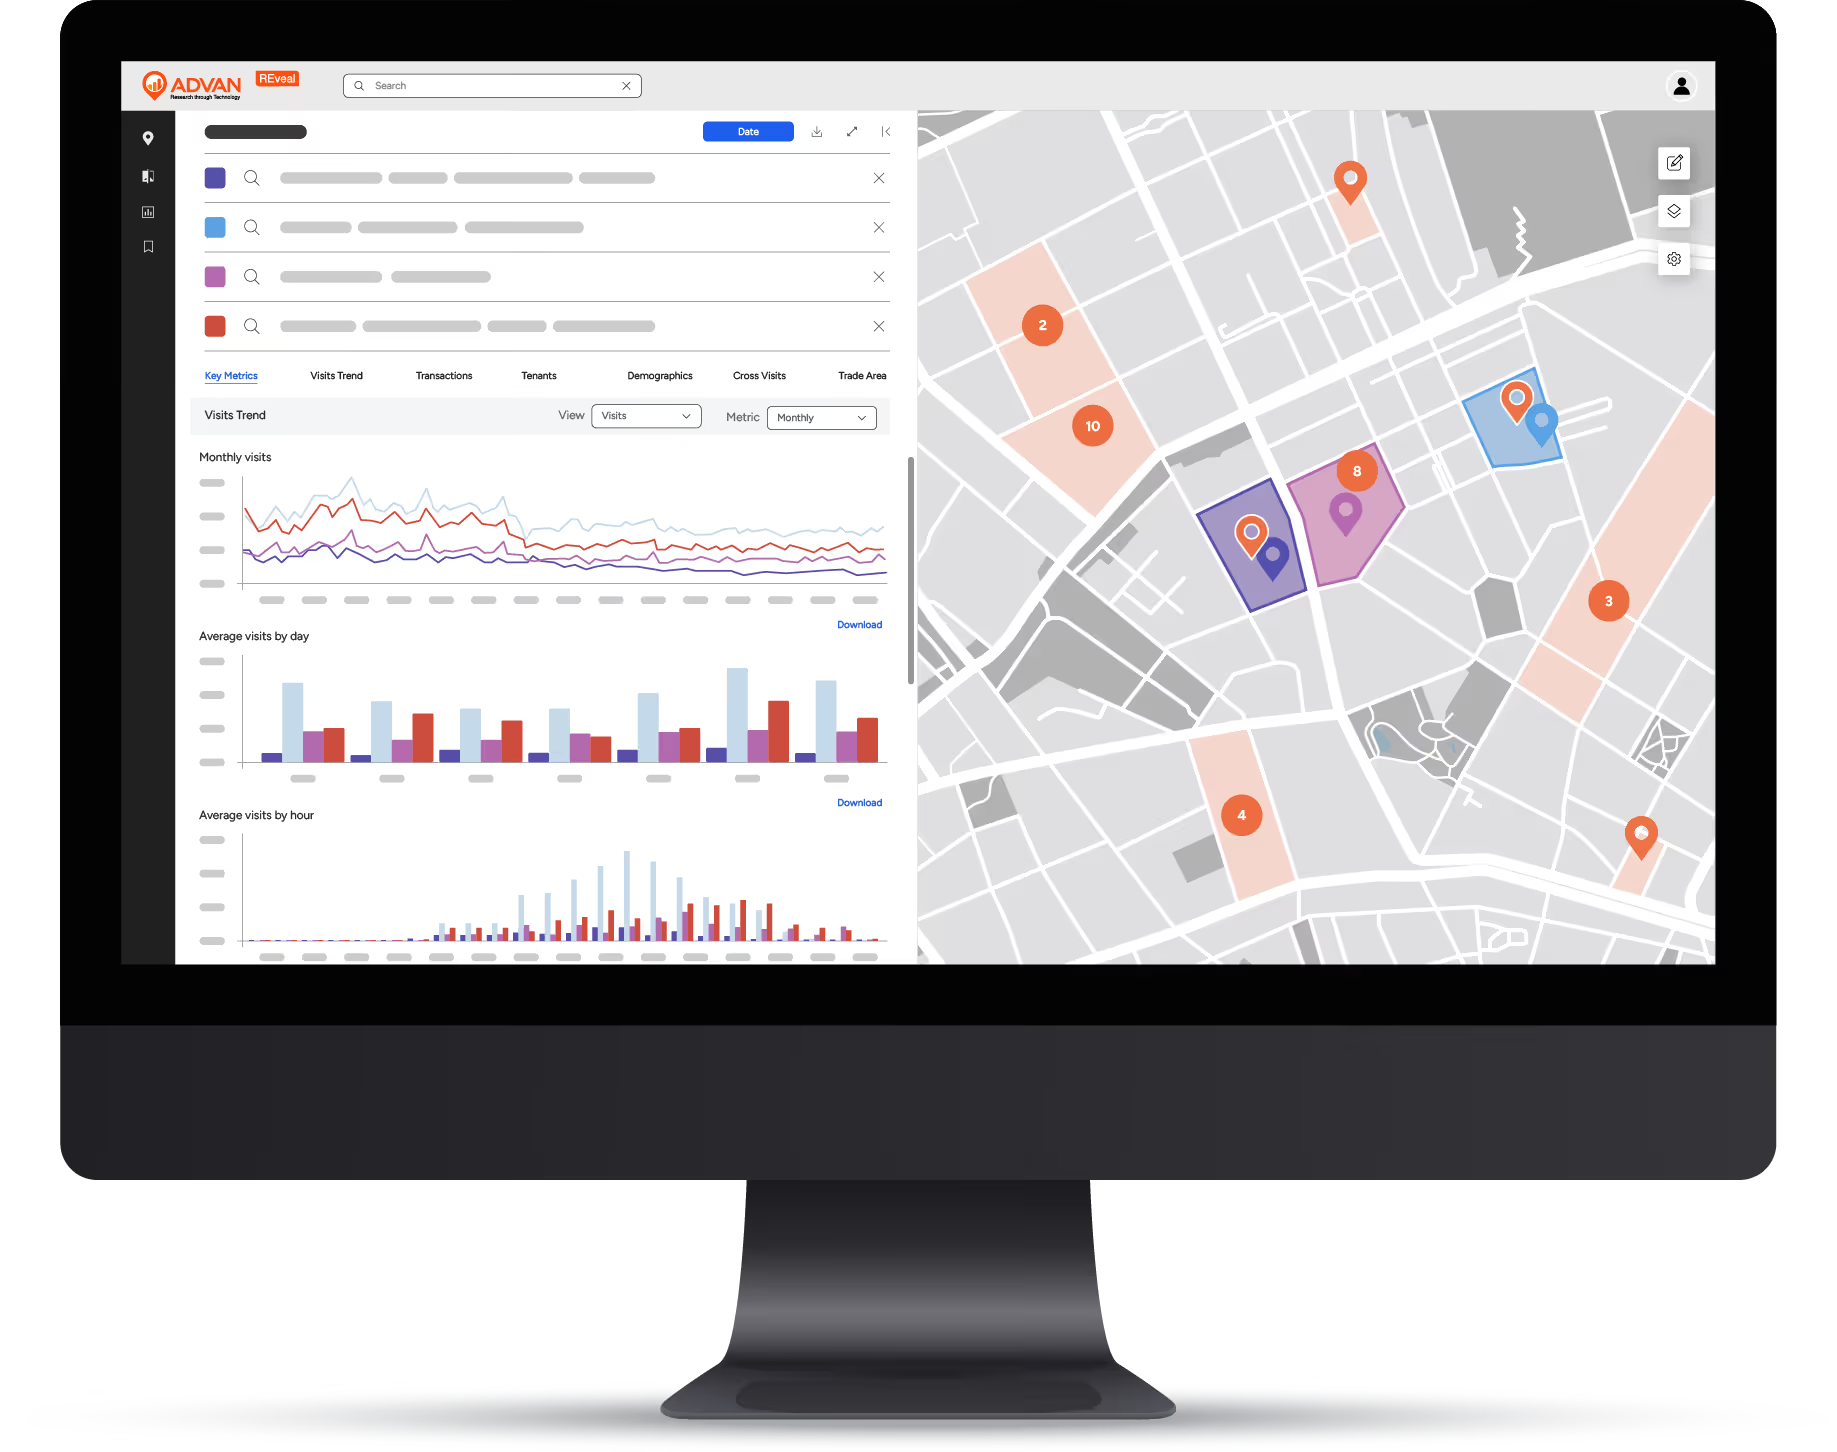
Flexible daily / weekly / monthly views and custom ranges.

Focus views by POI type, brand family, region, and polygon.

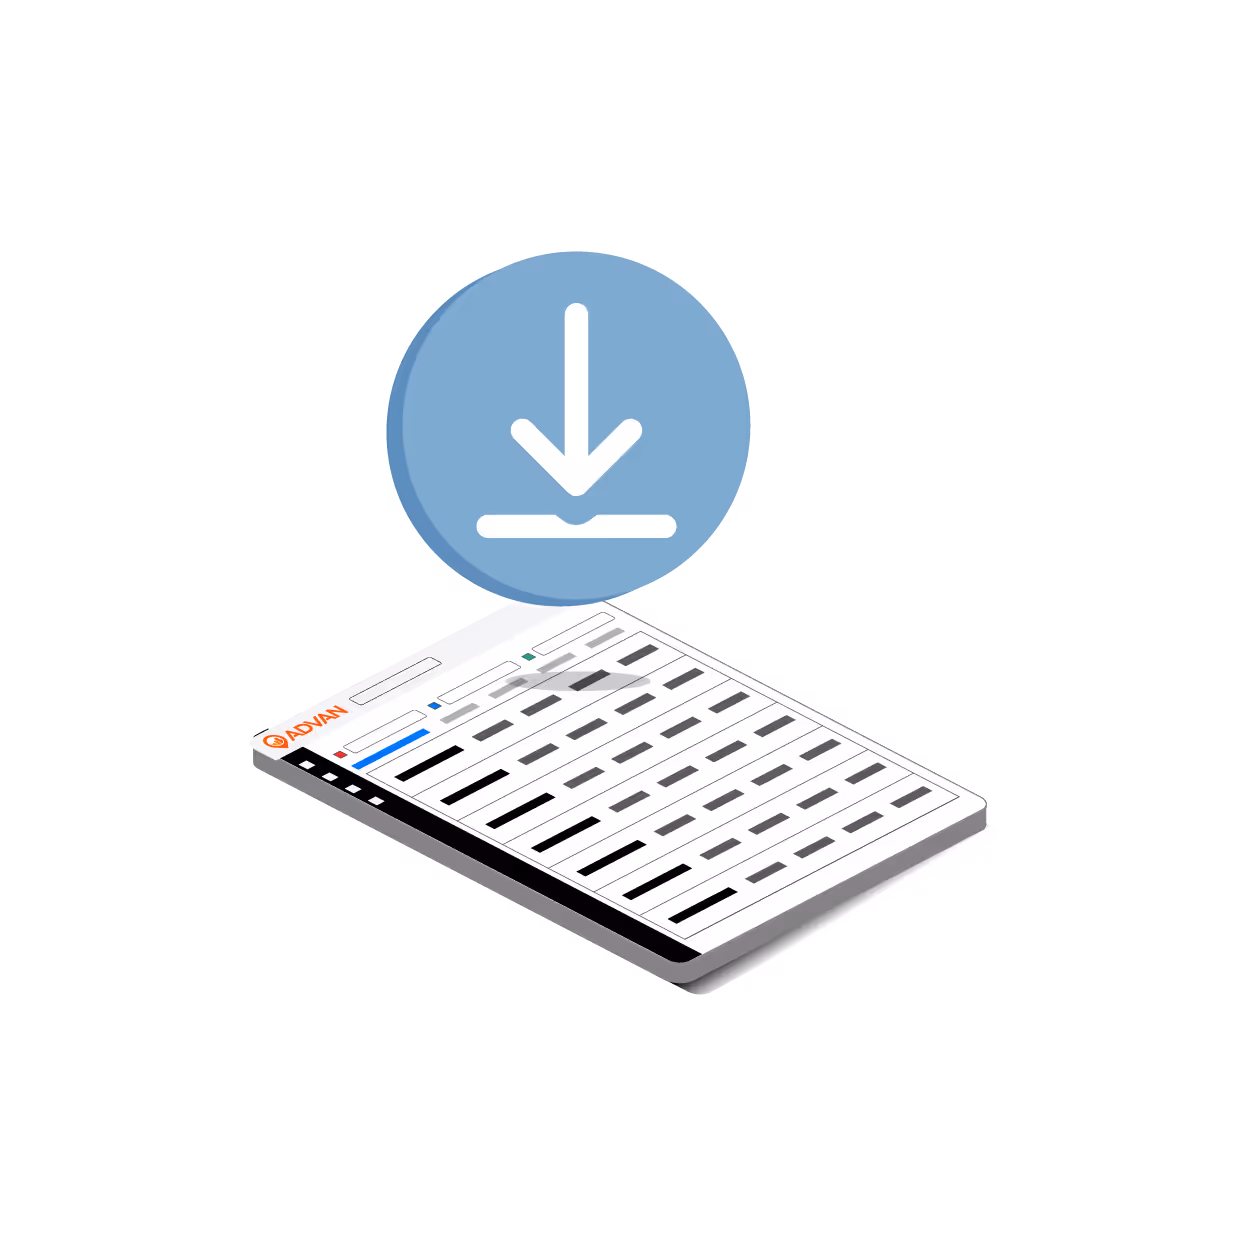
Visits, visit share, rank, trend, comparisons, and report exports.
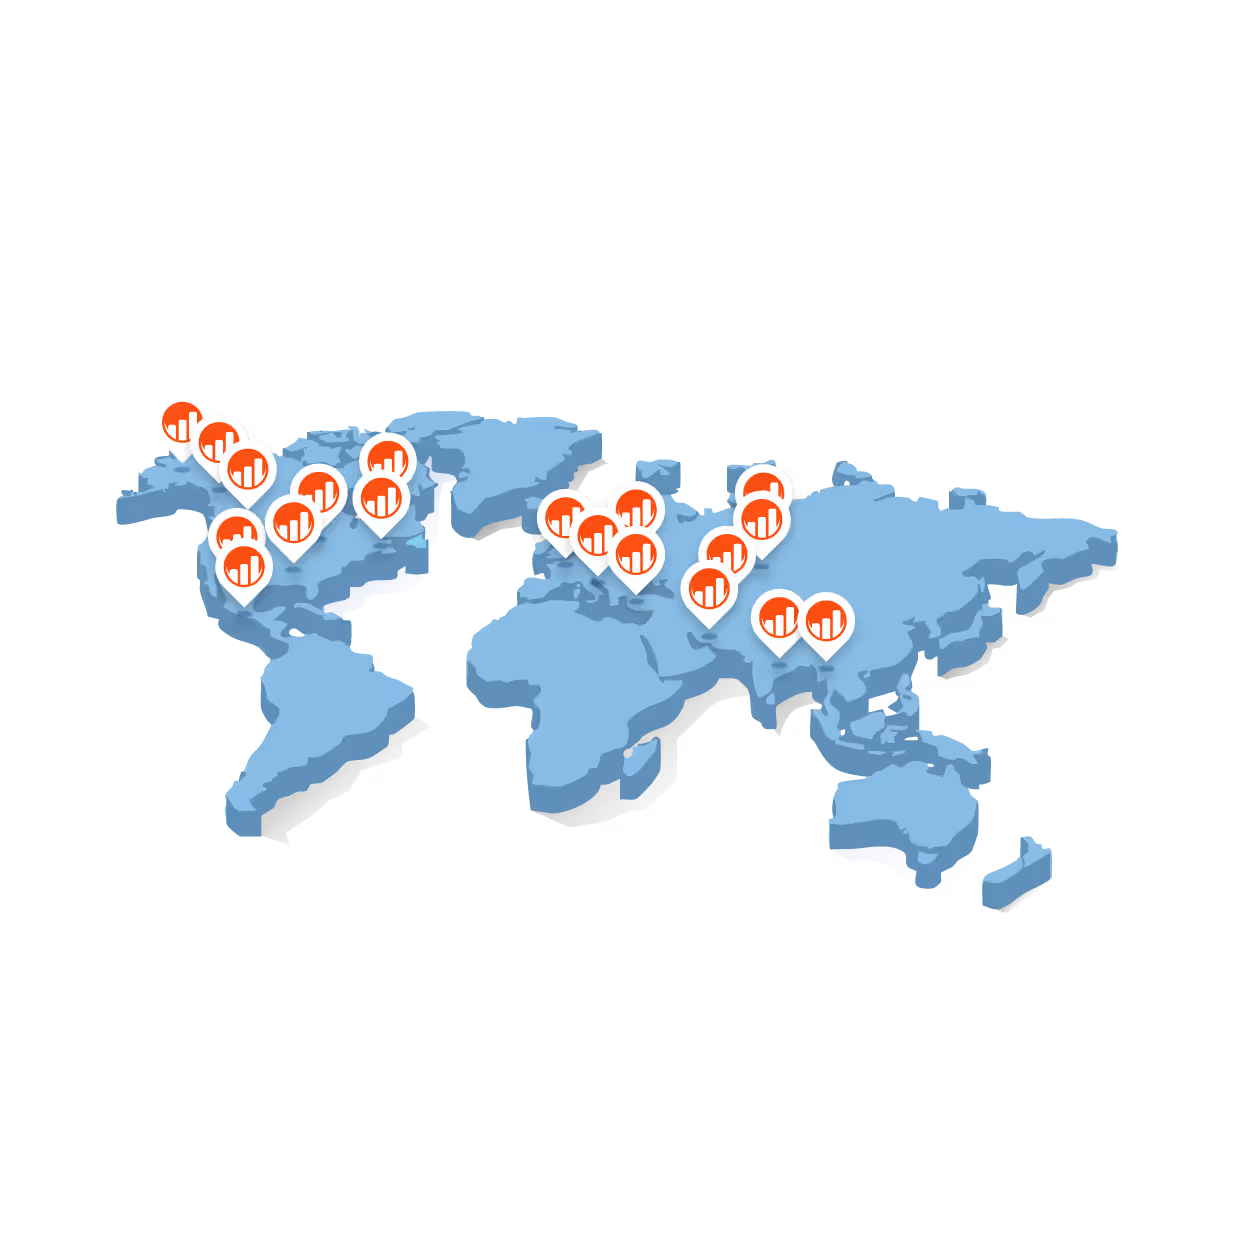
Analyze any POI worldwide, with deep US detail across 150M+ rooftops and 10M ADVAN-branded POIs spanning 8,000+ brands.

See how one location performs versus every other location of the same brand, nationwide. A powerful shortcut for expansion, consolidation, and performance reviews.
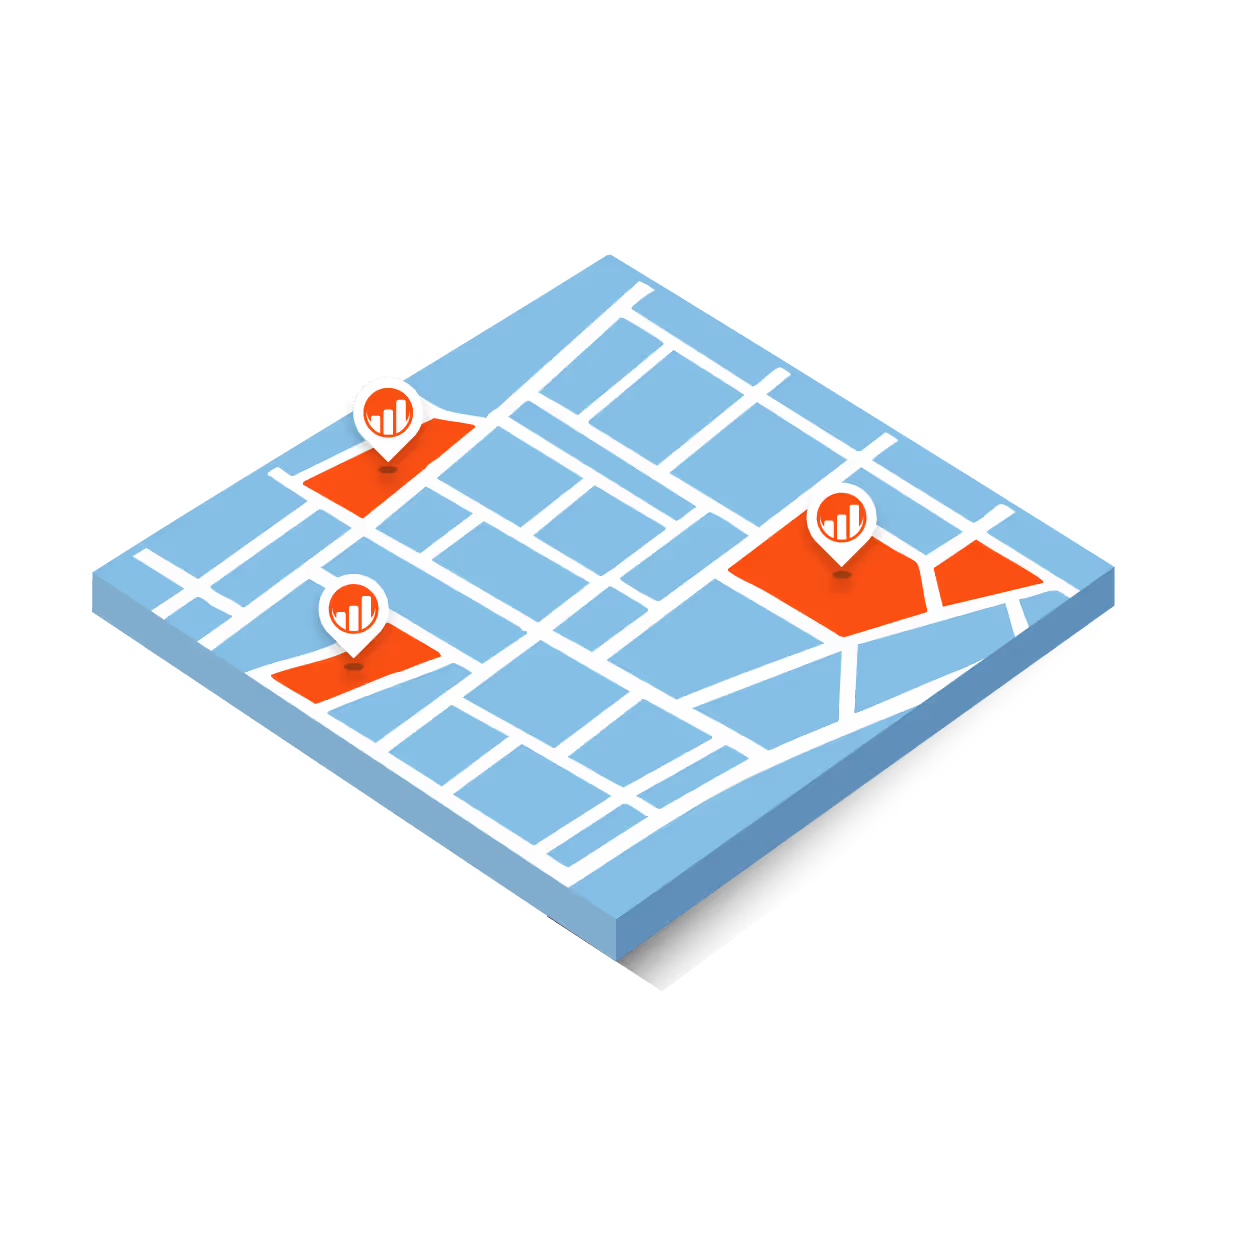
Draw any polygon (trade area, campus, event footprint, shopping district), and REveal instantly returns full analytics.

Understand who your visitors are by age, income, and other key attributes, layered directly into location analytics.
Built for PMs, real-estate teams, consultants, marketing teams, and investors. Clean interface, sensible defaults, exportable views, and shareable links.

See which tenants occupy a center or property and how they’re performing. A powerful tool for landlords, leasing teams, and investors.

Site selection, portfolio optimization, competitor benchmarking.

Leasing narratives, co-tenancy analysis, trade-area sizing, tenant mix insights.

Brand diligence, geo-cohorts, performance screens, and store-count theses.

Event measurement, district health, policy impact, demographic insights, business recruitment.

Full global POI reach plus deep U.S. granularity, no stitching multiple tools.

In-brand, nationwide comparisons built into every location view.

Treat any shape as a first-class citizen, no GIS gymnastics.

From map to answer in ~2–3 clicks; exports and share links included.
Share your details and we'll connect you with an ADVAN specialist to talk through your goals and set up a custom demo, including rankings, custom polygons, and exportable reporting tailored to your needs.
Standard reports cover ADVAN-branded POIs (US + international) and are included in base plans, except for Daily Visits, which costs 1 token. Custom reports are generated from your own polygons and use tokens.
Yes. REveal supports global POIs, with extensive U.S. depth across rooftops and brands.
No. Drawing polygons and building comparisons is point-and-click.
Data is aggregated and designed for insights at location/area level, not individual tracking.
Existing customers can still access a Legacy view from within the platform via the in-app “REveal Legacy” link.
Yes. All charts and tables can be exported to CSV, making it easy to integrate into your own spreadsheets, BI tools, or internal workflows.