
Each company trades based on different metrics, but it is fair to say that most consumer discretionary companies,
especially those with a growing footprint, are judged by their comparable store sales. This is defined differently by
each company, as it is not a standardized GAAP metric, but it typically means "we only measure the performance of stores
that have been open for a certain amount of time", usually anywhere from 3 to 13 months, depending on the company.
Shake Shack is a good example. Armed with geolocation data's ability to measure traffic down to individual locations for
any company, and using the consistent 4 years of history available to us, we set to analyze the chain's performance in
Q4 2019.
To compute the traffic correctly, we select only the specific SHAK stores that (a) are owned by the company, and
therefore have comparable store traffic reported, and (b) have been open for at least 13 months before the prior-year
fiscal quarter (or 25 months as of the fiscal quarter being reported), as this is the measure that SHAK uses to compute
comparable store traffic.
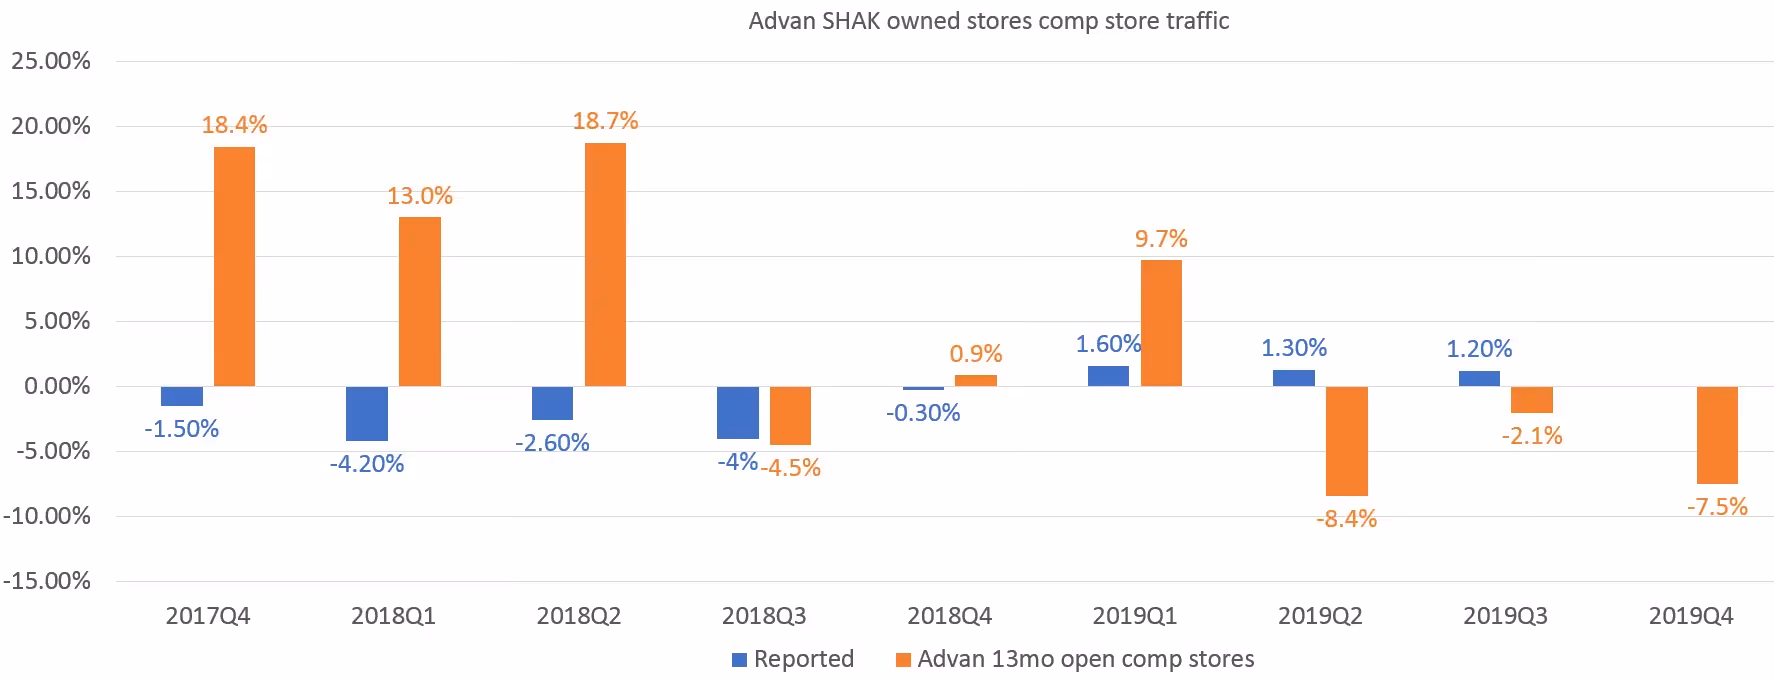
This is Advan's traffic data versus SHAK's reported traffic:
If it does not look perfect it's because there are a lot of variables going into the computation. It is unreasonable to
expect that even SHAK's traffic numbers are perfect. For example, some of the traffic that we compute may include
delivery drivers, which SHAK may or may not be including. We also do not know if SHAK is measuring traffic that enters
their stores or measures the outside seating areas as well; this depends on the people counting systems that they
use. What is important is that the numbers are correlated, especially in the last 5 fiscal quarters, and can be used as
a good indicator of the directionality of the traffic -- is it going to be higher this quarter or lower?
As you can see from the above, we forecasted a 7.5% drop in comp store traffic, which was below the concensus
estimate.
After the market close on February 24th the company reported same store traffic drop of 5.2% and comp store sales of
down 3.6% which were below the concensus estimate of -2.5%. Shake Shack's guidance was also below the lowest range of
expectations. As a result the stock opened at $63.92, a drop of 13.3% versus the close of $73.57 on February 25th.